When national results at Key Stage 4 were published last November phrases like “the gap between rich and poor widens” typified headlines in the national press. This was because the gap between the attainment of disadvantaged (often called Pupil Premium) pupils and others in the headline measure of 5A*-C including English and maths had increased from 27.0% to 27.4%.
Whilst only a small increase, this needs to be set in the context of substantial funding to improve the attainment of disadvantaged pupils. If this was not having any impact then, no doubt, some politicians might be led to wonder about whether or not this should continue.
What if we looked at this a different way?
Science fiction has often used the concept of a parallel universe – often one where many things look the same but some things are different. So, let’s imagine a parallel universe where education outcomes are the same but accountability systems are a bit different. How different? Let’s say that they are the same as what’s planned for this universe from 2016 onwards – with Attainment 8 and Progress 8 being the headline measures.
In this parallel universe indicators similar to 5A*-C (EM) are still around (in the guise of C+ in English and maths) but the big focus is in measures which count the performance of all pupils – their grades in 8 subjects with those for English and maths counting twice – and the progress they make from Key Stage 2 to Key Stage 4 based on this measure.
In this parallel universe we would have seen the gap (between advantaged and disadvantaged pupils) reduce each year for the last 3 years. Looking at the gap in Attainment 8 would show this:
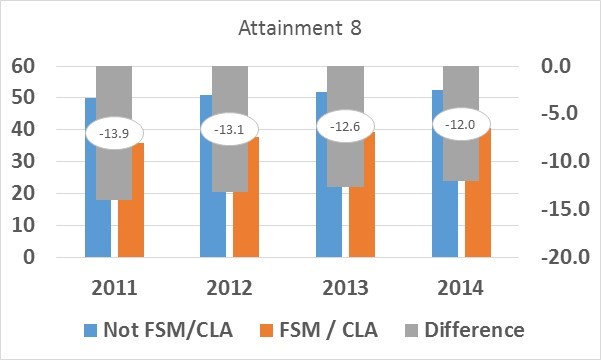
Attainment 8 gap 2011-2014
So how come that two headline accountability indicators based on exactly the same data give what seem to be contradictory outcomes?
- 5A*-C (including E&M) is a threshold measure. If pupil attainment improves but doesn’t reach the threshold then it doesn’t make any difference. Similarly, if attainment improves from above the threshold to further above the threshold that makes no difference either.
- Attainment 8 measures the average grades achieved by pupils across a range of subjects. If a pupil gets a D instead of an E grade this has the same impact as a pupil who gets a B instead of a C (at least in 2015 and 2016, see later for 2017 onwards).
What’s been happening over the last few years is that pupils with low prior attainment have been improving at a faster rate than those with high prior attainment.
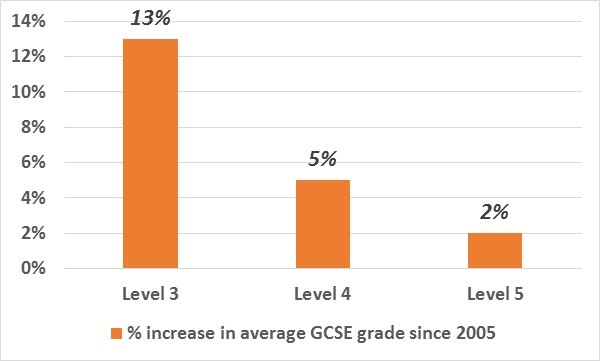
Increase in average GCSE grade since 2005
However pupils who start from level 3 at KS2 – even though they have been improving more rapidly than others – attained (on average) an E grade in GCSE subjects and so have no impact on the D/C threshold.
Whilst attaining C grades or higher is, of course, important for pupils, looking only at a threshold measure can mean that we fail to see improvements. Imagine that we had assessed the Olympic 100 metres by looking at the percentage of medallists who had dipped below 10 seconds. It would have been around 90 years before we had seen any change – despite the average time of the medallists gradually reducing over the same period.
And what happens if we unpack Attainment 8?
Improvements in Attainment 8 capture two things:
- What grades are pupils achieving?
- How many subjects do they take which count in Attainment 8?
Attainment 8 is made up from a number of components:
- English (score doubled if student takes both language and literature)
- Mathematics (score doubled)
- Other English Baccalaureate subjects (maximum of 3)
- Other approved subjects (maximum of 3)
We can look at Attainment 8 as two components:
- How many subjects which count in Attainment 8 do they study (Entry)?
- What is their average grade in these subjects (Points per Entry – PPE)?
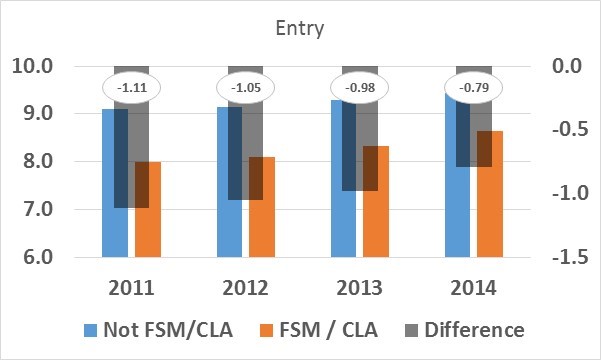
Gap in number of GCSE entries

Gaps in points per entry
It is clear that the gap in both has been closing and also that the gap in entry has closed more than the gap in attainment (points per entry). Both are important. Closing the gap in entry means that disadvantaged pupils are taking more subjects which are generally regarded as being those which offer them the most opportunity of future choices.
Will these trends continue in the future?
It seems likely that the trend of closing the gap in entry will continue as schools continue to respond to changes brought about by the Wolf review and to the requirements of Attainment 8.
Closing the gap in attainment might, though, prove more difficult:
- DfE’s recent announcement of the points scores to be used for ‘legacy’ GCSEs from 2017 onwards mean that improving from an E to a D will be worth less – in terms of points gained – than improving from a B to an A grade (see our blog on this).
- We will not know until 2017 whether the changes introduced by reformed GCSEs affect all pupils equally or whether they will prove to be ‘easier’ for some pupils.
Are there any other things we should consider?
The gap results from two things:
- Disadvantaged pupils, on average, arrive at school with lower attainment than others.
- They also, within each key stage, make lower progress.
The first part of closing the gap must, therefore, be closing the gap in progress. We’ll write about this over the next couple of weeks.
Looking at gaps in progress can also be important to distinguish between:
- Schools where the gap is bigger than we would expect from prior-attainment
- Schools where the gap is smaller than we would expect from prior-attainment
There are also important differences within the pupil premium group. Pupils are eligible for funding if they have been shown as entitled to free school meals (FSM) at any point in the last six years. School census is collected three times every year – so the pupil premium group can vary from those who have been FSM just once out of 18 time to those who have been FSM on all 18 occasions.
Last year we published initial findings about differences within the ‘pupil premium’ group and will be following this with further investigations in the future.
So, what should schools – and others – do when evaluating progress towards closing the gap?
We need to look at gaps in indicators that measure the attainment of all pupils (average grade, total points) as the primary indicator of whether the gap is closing.
In addition, looking at gaps in entry (subject choices) should be considered – and is likely to become more important over the next few years as the impact of reformed GCSEs and new points scores are felt.
Examining gaps in progress (value-added) should also form an important part of evaluation. We worked with Education Endowment Foundation in the development of their ‘Families of Schools’ toolkit. This includes the ability to look at the gap in terms of both attainment and value-added.
Looking at gaps in threshold measures (C or above for example) will continue to be important but we must not allow an over-focus on this to mask improvements which are not measured by this.


Leave A Comment