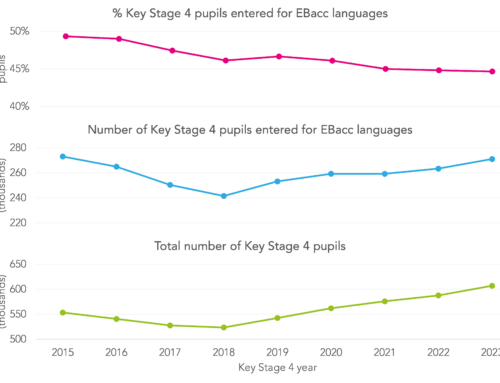
In a previous blog, we noted that Grammar schools tended to achieve above average Progress 8 scores based on 2014 data. At first glance, this is a worrying finding. Progress 8 is supposed to offer a fairer basis for comparing schools than measures of raw attainment. Moreover, this effect is not limited to Grammar Schools. Schools with the most able intakes, whether they are overtly selective or not, tend to achieve above average Progress 8 scores.
In Chart 1, we divide schools nationally into ten evenly-sized bands (deciles) and show the average Progress 8 score for 2014 for each band. Schools with the most able intakes, of which just over half are Grammar schools, scored an average Progress 8 score of 0.3. This indicates that their pupils achieved 3 grades higher on average than similar pupils nationally across the ten subjects counted in Progress 8 (allowing for double-weighting in English and maths).
Chart 1: Progress 8 and mean entries counted by school prior attainment decile, 2014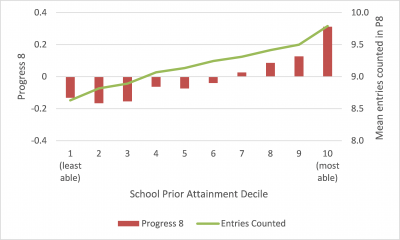
As the line on Chart 1 shows, some of the difference in Progress 8 scores is driven by entry patterns; pupils attending schools with the most able intakes were entered for an average of 9.8 subjects compared to a national average of 9.2.
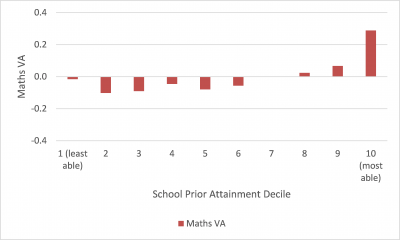
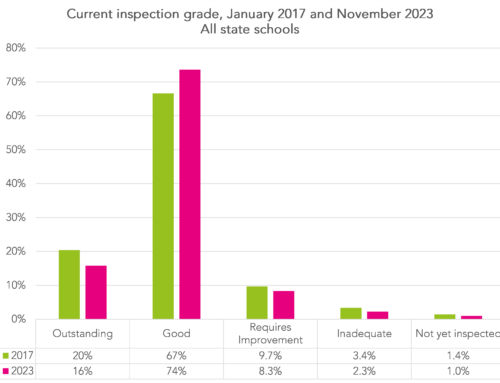
To try to show a comparison of progress between different types of school that is less affected by variations in entry patterns, Chart 2 presents value added (VA) scores in the maths component of Progress 8. Nationally, 99% of pupils had a double-weighted maths score counted in Progress 8 in 2014[1]. The result, for high-ability intake schools at least, is the same as for Progress 8 overall- they achieve an average score of 0.3.
Chart 2: Maths Value Added scores by school prior attainment decile, 2014
These results suggest that pupils at schools with the most able intakes really are making more progress than pupils with similar prior attainment who attend other types of schools. So what is causing this? There are many possible explanations, including:
- Their pupils tend to differ from other pupils with similar prior attainment in ways that have an effect on Key Stage 4 outcomes. They may tend to receive more support at home, for example;
- Their pupils have an effect on each other. Competition between pupils may be driving up their performance. There may be more time for teaching and learning due to pupils creating a more ordered environment for teaching and learning through better behaviour; or
- They may actually be more effective. They may be able to recruit better teachers, for example, because they tend to be the type of school the best teachers want to work.
The three examples above are not mutually exclusive but could be mutually re-enforcing. Is the progress ‘boost’ due to the pupils themselves or due to something the school has done? The honest answer is that we can’t tell from the data we have available. And because we can’t resolve this conundrum it means that Progress 8 is not a measure of school effectiveness. That said, it is absolutely fine as long as we appreciate it for what is- a descriptive measure of the relative progress of pupils at a school.
Leave A Comment