How’s your driving? Below average, pretty normal, or better than most?
Research suggests that the majority of our readers have just answered ‘better than most’. They are surely wrong. Only half of drivers can be better than the median. The other half are, by definition, below it.
This is an example of what psychologists call ‘Illusory Superiority’, a phenomenon which is by no means limited to our skills behind the wheel. Studies have shown that we tend to overestimate our ability relative to others in a range of areas from leaderships, to parenting and even social skills.
What about schools? Surely teachers, with access to Ofsted judgements, regular testing and sophisticated outcome measures, have an accurate picture of their performance?
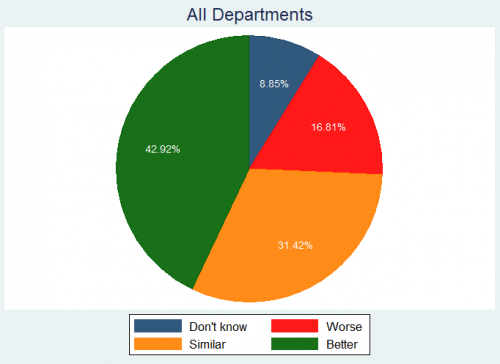
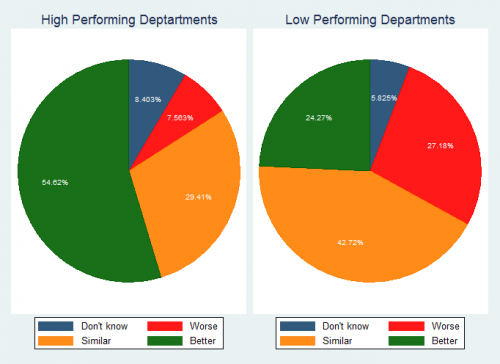
We surveyed a representative sample of over 200 English, maths and science Heads of Department to find out. Figure 1: How is your department performing relative to others with a similar intake? We then calculated performance measures that control for school intake and split the departments into two groups based on their scores. The results for low performing departments are particularly striking. Almost a quarter incorrectly believe themselves to be high performing, with another 43% believing they perform similarly to others. Figure 2: How is your department performing relative to others with a similar intake? So according to our data, many Department Heads do indeed suffer from illusory superiority. If you’re a middle leader reading this, you probably still think your one of the select few with an accurate assessment. But that’s the thing about illusory superiority: we all think we’re special. Given the prevalence of performance data these days, how can it be that so many Department Heads don’t have an accurate picture of their own performance? Recent research suggests that the dominant reason is our desire to avoid undesirable judgements about ourselves. This urge is particularly strong when we are being assessed on important tasks, such as teaching. Some middle leaders are simply choosing to ignore the data. Departmental Heads buried in the sand. This cannot be good for schools, or pupils. Fortunately the research on driving offers pointers on how we can keep illusions of superiority in check. Motorists were found to offer more accurate assessments of their performance when they expected their judgement to be reviewed by others afterwards, particularly if they saw the reviewer as high status. So what should schools do? Middle leaders could help keep themselves honest by collectively reviewing each other’s exam performance. An annual inter-school meeting to analyse results would be a start. The Families of Schools database, which groups schools with similar intakes, can help make these comparisons more transparent. But what really matters is that performance is reviewed by respected, knowledgeable colleagues. We are all prone to thinking we’re better than we really are. Even you. That makes collaboration the only reliable antidote for complacency.

Hi Sam,
This is an interesting read; one which I happened to look at again as I searched the site for ‘science’, looking for any insights you might have into accountability in science departments at KS4.
I’d be interested to know what methodology you would use to categorise a science department as high or low-performing.
I’m a head of science who has a real interest in performance data, – mainly driven by the fact that there are so many spurious statistics thrown around in the schools I’ve worked in -, and I am struggling to work out whether we’re genuinely performing well or not.
We have a fairly clear idea of how students perform in Maths and English because every student sits them. All we need to do is look for a number of schools with a similar intake and socioeconomic circumstances and we know how we’ve done in maths and English. Next, every faculty head will have to fend of questions like “why are students making more/less progress in …….?”, despite nationally documented cross-subject variation.
The bigger problem is that every other qualification is subject to varying entry patterns as well as outcomes – none more so than the suite of science GCSEs. If I sit down with some of the other faculty heads in our local network, we will have conversations along the lines of “Well, we entered every student for Core/Additional so we would expect our attainment/levels of progress to be lower as a percentage” or “We entered just out top 15 students for separate sciences whereas you entered your top two sets”.
So whilst we have expected differences, the question remains as to *how* different they could or should be. I realise that all ‘headline’ figures are flawed to an extent but as far as I’m aware, – and I’m hoping you’re about to correct me -, there is nothing published that allows school leaders to “easily” compare the effectiveness of their science departments.
The closest I think I can get is the RAISEonline transition matrices for each course we do but this doesn’t seem to be a tool that is routinely used by other departments within the schools I’ve worked in or by the other heads of science locally, probably because of the investment of time required.
Could there not be a single measure by which science departments can be compared across schools? I realise this one has the potential to skew entry patterns but is probably inline with other accountability pressures and the current political direction – what about the percentage of the whole Y11 cohort achieving two ‘good’ grades in science, rather than the percentage of those entered for it, which has been previously published on the Ofsted Data Dashboard? – or the APS for EBacc Science, with those not entered getting zero?
Would love to hear your thoughts or someone else on your team!
Tim