Secondary schools can now download the marks achieved by each of their new year 7 pupils in every question from the 2015 Key Stage 2 tests. Even better, this data can be imported into RAISEonline so that analysis of test performance can be undertaken for a year group, class or individual pupil broken down by attainment target and topic. Surely this is a good thing? Well broadly, yes, provided it is used cautiously and alongside your professional judgment.
Caution is needed because the measures may not be terribly precise, certainly at pupil level. When we give a pupil a test, we are trying to obtain a ‘true’ measure of his (or her) performance. What we actually get is a measure of this ‘true’ score give or take a bit of error. We could attenuate this error, that is achieve a more reliable result, by increasing the number of items in the test. However, this comes at the cost of diminishing returns. The more reliable a test becomes, the exponentially longer it needs to be to make it even more reliable. No-one would want a super-reliable KS2 maths test which took a week to complete.
So a compromise between reliability and length is struck. The maths test now consists of 2 45 minute papers and a mental maths exercise. By any standards, the results are pretty reliable. Or at least they were- more published information on test reliability would be welcome. But armed with a measure of reliability and the national spread (standard deviation) of test marks, you can calculate something called the standard error of measurement (SEM). Based on published reliability measures for 2009 and 2010, we find that the overall SEM for KS2 English and maths tests was around 4 marks.
In plain English, 68% of pupils achieved scores that were within 4 marks of their ‘true’ scores. In practice it’s probably a bit more complicated as tests are typically more reliable in the middle of the ability distribution and the SEM varies by ability. But the KS2 tests are measuring something reliably. Whether they are measuring what we want them to measure (or what we think they are measuring) is a much more complex issue best left to wiser heads than mine.
So a KS2 test will give you a pretty good indication of pupil performance. Better still, when aggregated over a whole class (or year group) the errors in pupils’ scores largely cancel out. The problems arise when you start analysing parts of a test. Put simply, there is much less reliability in measures broken down by attainment target and topic.
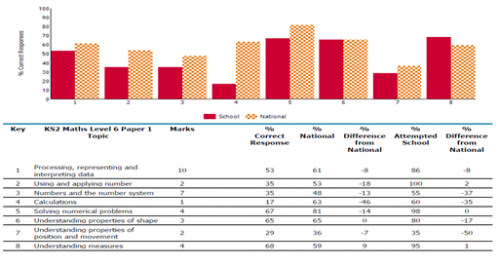
Let’s take the topic of understanding properties of shape from the maths test(s) as an example. Out of 100 items in the 2015 tests in total, only 11 related to this topic. To obtain a good indication of a pupil’s performance in understanding properties of shape, for example, you would need to give them a well-designed test consisting of sufficient items on that topic to provide a reliable enough score. This article (behind a paywall unfortunately) provides an excellent introduction to the difficulties of producing sub-scores from tests.
So although the overall KS2 test score of an individual pupil is a pretty good indicator of performance, the question-level data is unlikely to be sufficiently reliable on its own to identify the strengths and weaknesses of individual pupils. It could certainly be used alongside professional judgment to assess the strengths and weaknesses of a year group or, at a push, a class, provided you don’t read too much into small differences in performance between different topics. And of course you can always administer your own internal tests if your professional judgment is at odds with the test data.


Leave A Comment