In this blog, we examine the variation between areas in rates of first degree achievement and further education participation at age 19 or above. Young people who were living in London at age 15, particularly those who were eligible for free school meals, were more likely to go on to achieve a degree than those living elsewhere in England. This tends to suggests that the gap in Key Stage 4 attainment that began to emerge in the early part of the century between disadvantaged pupils living in London and those living elsewhere persisted into higher education. But this wasn’t so much the case for White British pupils.
This is the second blog we’ve written on the routes taken through the post-16 education system by three cohorts of young people who turned 16 between 2002 and 2004. The first, on how young people from disadvantaged backgrounds are more likely to participate in further education, can be found here.
Variations between local authorities
We identify the local authority district in which pupils were living at age 15, the final year of compulsory schooling. Our analysis is restricted to pupils attending state-funded schools. Figure 1 shows the variation in subsequent rates of degree achievement and FE participation after age 19 across the 324 districts in England. The dark orange lines denote national averages. There is an inverse correlation: as might be expected, areas with high degree achievement rates are likely to have low participation rates in FE after age 19.
Figure 1: Percentage of school leavers a) achieving a first degree by 2013/14 and b) participating in FE aged 19+ by local authority district of residence at age 15
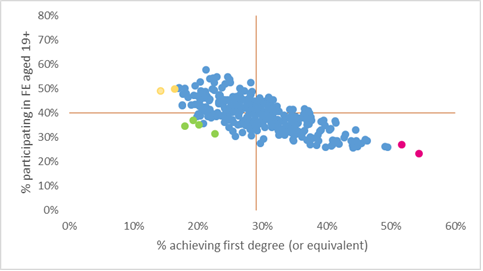
Over half of young people who were resident at 15 in the Chiltern district of Buckinghamshire or the London Borough of Harrow (the dark pink dots) had achieved a first degree by 2013/14. This contrasts with 14% in Hull and 16% in Blackpool (the gold dots). There are also a small number of districts with below average rates of both participation in FE and first degree achievement including a cluster in Essex (the light green dots): Basildon, Castle Point, Harlow and Thurrock.
What can this data tell us about London?
Linking Key Stage 4 data to data on participation and achievement in further and higher education can cast further light on the so-called “London Effect”.
In a very thorough working paper, Jo Blanden and colleagues dissect the improvement in attainment amongst disadvantaged pupils- defined as those eligible for free school meals in their final year of schooling- in London relative to those living elsewhere in England. They conclude that this improvement began before the introduction of a range of policies designed to tackle low attainment such as London Challenge, Teach First and the City Academies Programme.
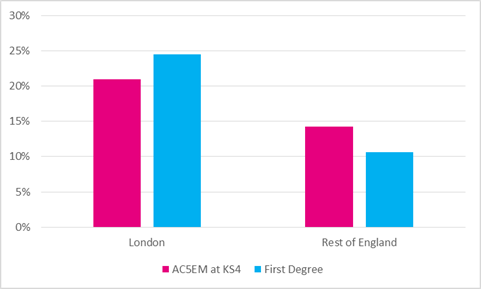
The three cohorts we examine here were among the first to benefit from the improved performance of London’s schools. As Figure 2 shows, 21% of disadvantaged pupils who attended schools in London achieved 5 or more A*-C grades at GCSE including English and mathematics (AC5EM), 7 percentage points higher than their counterparts in the rest of England. By the end of 2013/14 almost a quarter of disadvantaged pupils who were living in London at age 15 had achieved a first degree. This was more than double the rate among disadvantaged pupils living elsewhere.
Figure 2: Percentage a) achieving 5 or more A*-C grades including English and maths at Key Stage 4 and b) going on to achieve a first degree by the end of 2013/14, disadvantaged pupils completing Key Stage 4 2001/2 to 2003/04
The role of ethnicity
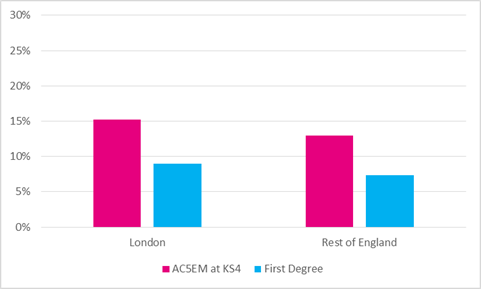
But as Simon Burgess noted here, ethnicity plays a prominent role in the London story. In Figure 3 we look just at White British disadvantaged pupils. The “London effect” is much less evident for this group.
Figure 3: Percentage a) achieving 5 or more A*-C grades including English and maths at Key Stage 4 and b) going on to achieve a first degree by the end of 2013/14, white British disadvantaged pupils completing Key Stage 4 2001/2 to 2003/04
What is striking is that there has historically been a higher rate of disadvantaged pupils in London’s schools than elsewhere in England. Across the three cohorts we examine here, 24% of pupils attending London schools were eligible for free school meals in their final year of compulsory schooling compared to 13% of pupils elsewhere. But among White British pupils, the difference was much smaller (15% in London, 11% elsewhere).
Blanden et al suggest that the families of pupils eligible for free school meals have comparable living standards throughout England as benefit rates generally do not vary across the country, housing benefit aside. But while this may be true, disadvantaged pupils in London appear to differ from disadvantaged pupils in the rest of England in other ways which influence attainment at age 16 and beyond. We’ll come back to this in another blog.

Leave A Comment