At the launch of the Social Market Foundation’s Commission into Educational Inequalities a couple of weeks ago, the observation that regional inequalities had widened since the 1970s garnered a great deal of interest. The analysis released by the Commission was just a starting point and I, alongside the other Commissioners (Rt Hon Nick Clegg MP, Suella Fernandes MP, Stephen Kinnock MP and Sam Freedman), are now exploring these geographical inequalities in more detail. Here are the reasons why we are unlikely to tell a straightforward story.
London schools do well, but not necessarily better than all other regions
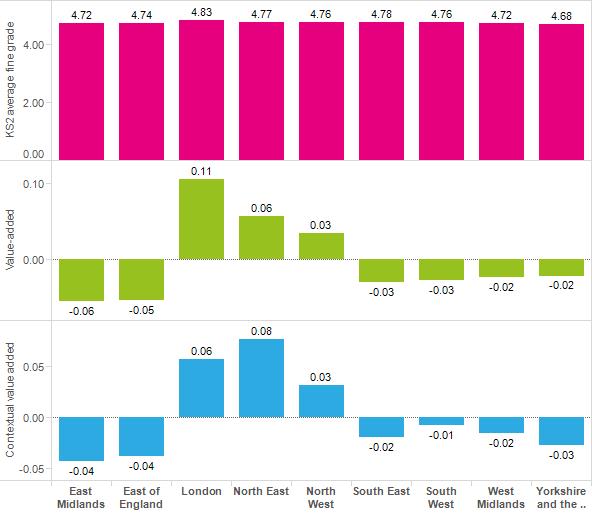
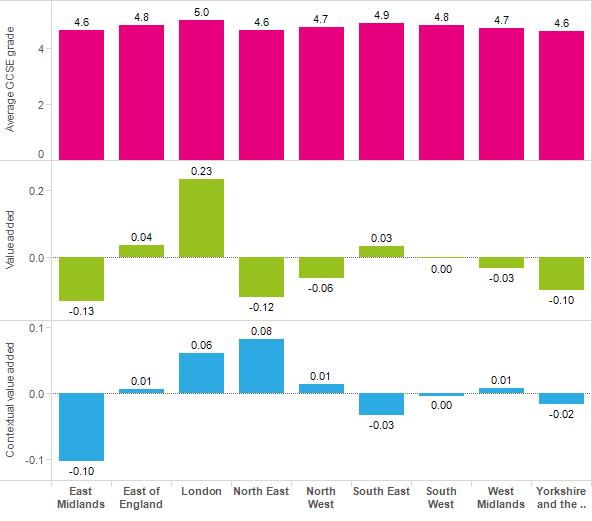
Students in London perform best and make the most progress between Key Stages in both primary and secondary schools. But London children are different to other children. If we compare children with similar demographic profiles educated in schools in similar contexts, another region does surprisingly well: the North East. I don’t know why, and creating measures such as Contextual Value Added that try to account for social context is always controversial, but we must remember that regions are often look different in their educational performance simply because they are different in their social context.
Primary school attainment at age 11 by region
Secondary school attainment at age 16 by region (note C=5.0, D=4.0, etc…)
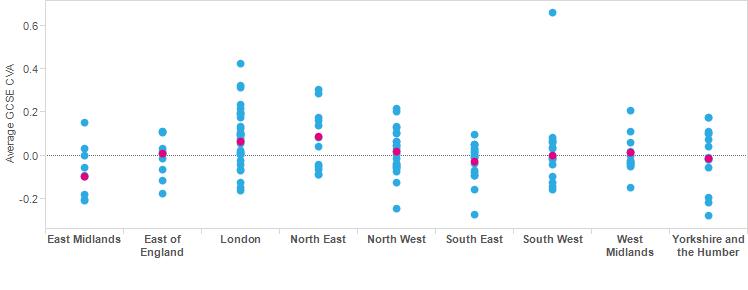
There is far more difference in school performance within region than there is between regions
Yorkshire and the Humber might not look like it has a great education system, but there are individual local authorities such as Hull that seem to do quite well. London looks great overall, and yet areas such as Enfield perform relatively poorly. Indeed, as Figure 3 shows, there is significant variation in local authority performance within regions.
Local authority contextual value added at Key Stage 4
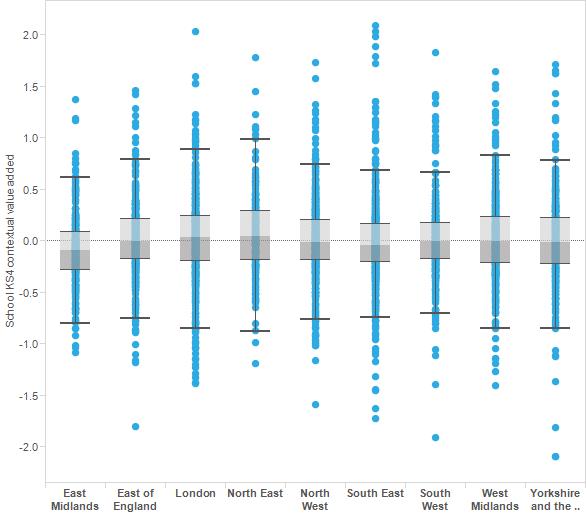
And when we look at the performance of the 3000 secondary schools in the country, it is true that London secondary schools are skewed towards the positive end of the distribution, but there are schools showing weak and strong performance in all parts of the country.
Distribution of England’s secondary schools (KS4 CVA)
We must look beyond our largest concentrations of social disadvantage
The social context of London is unique – and has uniquely changed. Everyone agrees that most (or all) of the improvement in London secondary schools can be explained by demographic change. Indeed, in his recent blog post, Dave Thomson argues that the improvement in the performance of schools with very high concentrations of disadvantage, both in London and elsewhere, is the most important school improvement story of the past decade.
Why this has happened we do not know: should we celebrate successful school improvement policies or were schools simply beneficiaries of changes in the communities they serve? Either way, this improvement in schools with high concentrations of disadvantage combined with an overall social class gap in attainment that has closed very little suggests we have to look more closely at the experiences of individual families and small communities of social disadvantage that are rather scattered across our country and across our schools. It may be that differences in the educational experiences of children from different backgrounds within the same school, rather than the differences in school qualities of those serving different communities, are the next frontier in the fight to reduce inequalities.
To better understand how we can support the educational success of individuals who are scattered across all schools in all regions is a challenge for the Commission indeed.




Leave A Comment