This year, 81 schools are using the new Proof of Progress Tests (PoP tests) from FFT to assess writing and conceptual understanding in maths at the start and end of Year 7.
The tests are designed to be sensitive to learning, but resistant to practice effects. In other words, we would only expect pupils to improve their scores on the tests if they are genuinely improving in maths and English.
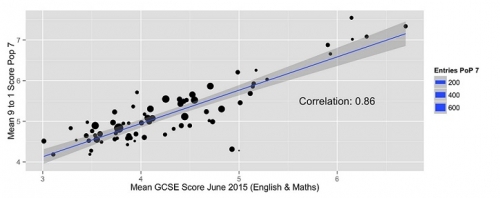
The results from the baseline tests show that there is a very close relationship between the results schools received in June 2015 in English and Maths, and their PoP 7 results. The figure below plots the average GCSE score for each school from June 2015 against their average PoP 7 grade in September 2015. The correlation of 0.86 suggests that most of the variation in a schools’ GCSE results can be explained by their Year 7 ability profile. This is nothing new.
However, take a closer look at the graph and you will still see a great deal of variation by school. We already know from our pilot last year that some schools will progress faster than others over the course of Year 7. What will be fascinating is to see how these bubbles on the chart move after the progress tests in June.
The moving bubbles cannot be explained away by poor fit to a statistical model – we don’t use any statistical models to measure progress. Our experts in English and maths directly compare the work of the pupils in September and in June, completely blind as to when the work was produced. There will be some sampling and measurement error, as there is for any test, but we can account for that.
What will be left is genuine proof of progress.
We have previously blogged about proof of progress, you can read these blog posts by clicking on the links below:
Measuring progress in English and Maths
Josh and the Dragons: Measuring Creative Writing
Leave A Comment