Secondary schools today received provisional Progress 8 data for 2016. This is a significant milestone given the importance attached to Progress 8 in the secondary school accountability framework.
The rest of us will have to wait until provisional data is published in October.
In the meantime DfE has published some very useful technical information that anyone can see on its performance tables checking site.
This information gives us some clues about how Progress 8 and Attainment 8 have brought about changes to the curriculum in schools.
In the chart below, we look at the change in average Attainment 8 scores for each prior attainment band between 2014 and 2016. (We use data for 2014 because 2015 was heavily affected by the Key Stage 2 boycott of 2009.)
It is clear that Attainment 8 scores have risen most sharply for pupils with a fine grade of between about 3 and 3.9 at the end of Key Stage 2.

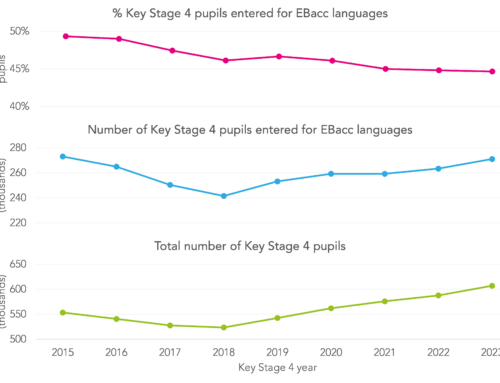
Most (but not all) the increase in Attainment 8 has been driven by an increase in entries in the English Baccalaureate (EBacc) subjects.
In 2014, our calculations suggest pupils with a mean KS2 fine grade of 3.0 entered 0.9 EBacc subjects on average, and those with a fine grade of 3.9 entered 1.59 subjects. The equivalent figures for 2016 were 1.84 and 2.43 respectively.

As we have written previously, an increase in entries in EBacc subjects for lower-attaining pupils is not necessarily a bad thing. We plan to return to this research later in this term.


Very clear and helpful. We have a particular interest in maths, where changes in A8 / P8 are more likely to reflect performance rather than participation in the exam. As you explain, the 2015 results are hard to interpret because of the SATs boycott – are the 2014 maths A8 coefficients available anywhere?
Hi Matt. Thanks for commenting. I found the 2014 estimates here: http://www.sisraanalytics.com/downloads/sa/reports/Progress82014elementbreakdown.pdf
wonderful, thanks Dave and Sisra.
Following the same analysis as here shows a similar but less drastic picture for maths. Compared to 2014, lower attaining students in 2016 tend to have higher A8 scores, up to 1/2 a grade, and L5 students have lower scores now than two years ago. The largest group of students – with L4 at KS2 – are largely unchanged between 2014 and 2016.
thanks again,
m.