Since the government’s announcement that it wants to see the return of more widespread selectivity to England’s education system we have written quite extensively about grammar schools and the impact of selectivity.
In this post, however, we’re going to step back a little and offer a more descriptive overview of the existing network of selective schools, as we and others start to prepare our submissions to the government’s green paper consultation.
Much of the data used in this post comes from the Department for Education’s published performance tables, augmented in places by our own analysis of the National Pupil Database – and we’re making all of the data available to others looking to build their own understanding of grammars.
Deprivation
There are 163 grammars in 36 local authorities, though this ranges from wholly selective systems – such as in Kent, Medway, Buckinghamshire and Lincolnshire – to areas with only small numbers of grammars or single grammars, such as Cumbria.
The size of the cohort completing Key Stage 4 (Year 11) at grammar schools ranged from 56 to 209 pupils in 2014/15, with a median of 136.
The number of disadvantaged children – defined as those who had been eligible for free school meals at any point in the previous six years (so-called FSM6), or who had been looked after at any point – in these Year 11 cohorts ranged from 1 to 32 pupils[1].
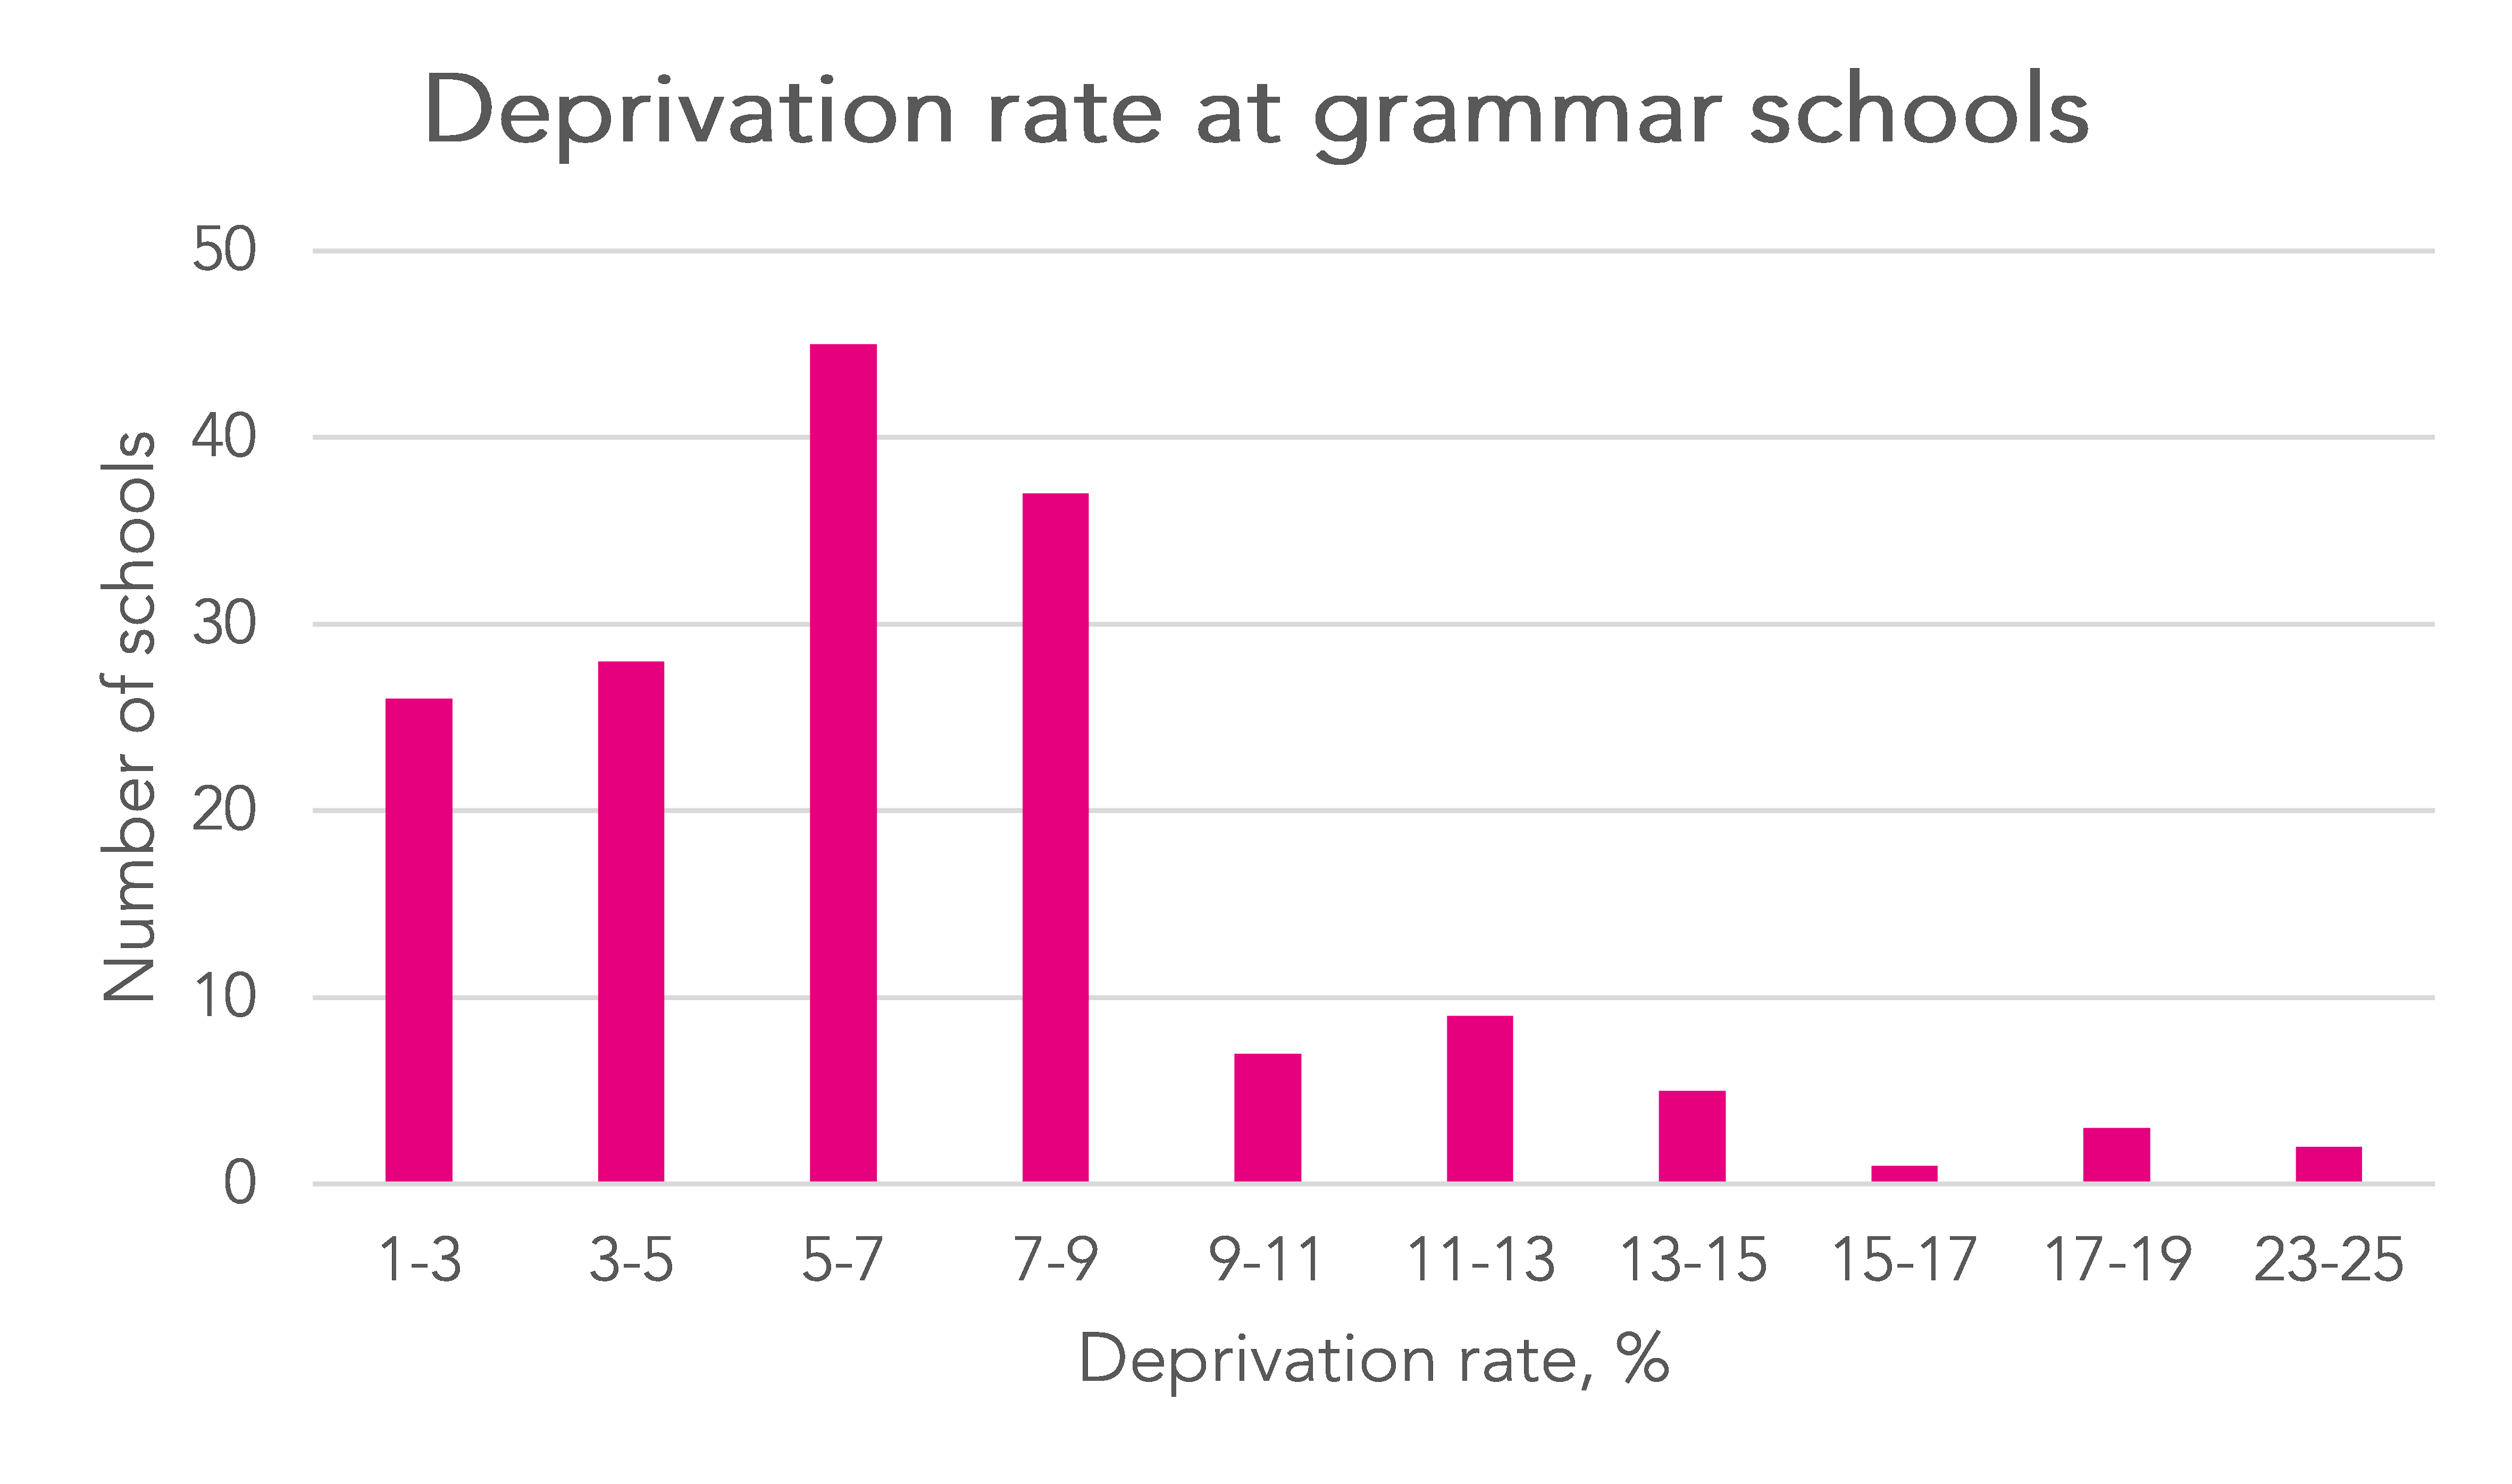
Overall, 1,402 out of 22,497 pupils at the end of KS4 in grammar schools were disadvantaged, or 6%. For comparison, across all schools nationally we think around 27% of children in Year 11 had been eligible for free school meals in the last six years. The same seems to be broadly true of more recent intakes: 7% of those who were in Year 7 at a grammar school in 2014/15 are recorded as being FSM6, versus 31% nationally.
At a school-level, the share of disadvantaged Y11 children at grammar schools ranged from 1% to 24%.
 View the full, school-by-school data here. (Cells without shading are sourced directly from DfE performance tables. Cells shaded blue contain figures produced by Education Datalab based on analysis of the National Pupil Database.)
Local area deprivation
To make sense of these figures on disadvantage, it’s helpful to look at the rates observed in the areas in which the grammar schools are located[2] – done at the local authority, local authority district and neighbourhood level[3].
In only one case – Stretford Grammar School in Trafford – does a grammar school admit a greater proportion of disadvantaged children than is present at the local authority or local authority district level. Looked at at the lower, neighbourhood level there are four grammars that accept disadvantaged children at a rate above that seen locally.
Among those selective schools that admit a smaller proportion of disadvantaged pupils than is seen locally, at both local authority and local authority district level the gap is as great as 42 percentage points – observed at King Edward VI Camp Hill School for Boys in Birmingham.

View the full, school-by-school data here.
Disadvantaged pupils v prep school entrants
Another comparison that can be made, and which has been done by others such as the Sutton Trust in the past, is between the number of disadvantaged children which selective schools admit and the number of children who have attended independent primaries, or prep schools.
The proportion of Y11 pupils at grammar schools who we think[4] attended prep schools is as high as 71%, though it’s worth noting that this figure relates to Cranbrook School in Kent, which admits at age 13 – which probably explains why the prep school rate is considerably higher here than at other grammars. The next highest prep school figure is 40%.
Overall, we think that a little less than 3,000 of the 22,497 children at the end of KS4 at grammar schools in 2014/15, or around 13%, had attended prep school, versus the 6% who were deprived. (Looking at Year 7 entrants to grammars in 2014/15, the prep school figure appears a little lower, at around 11%.)
View the full, school-by-school data here.
A different measure of deprivation
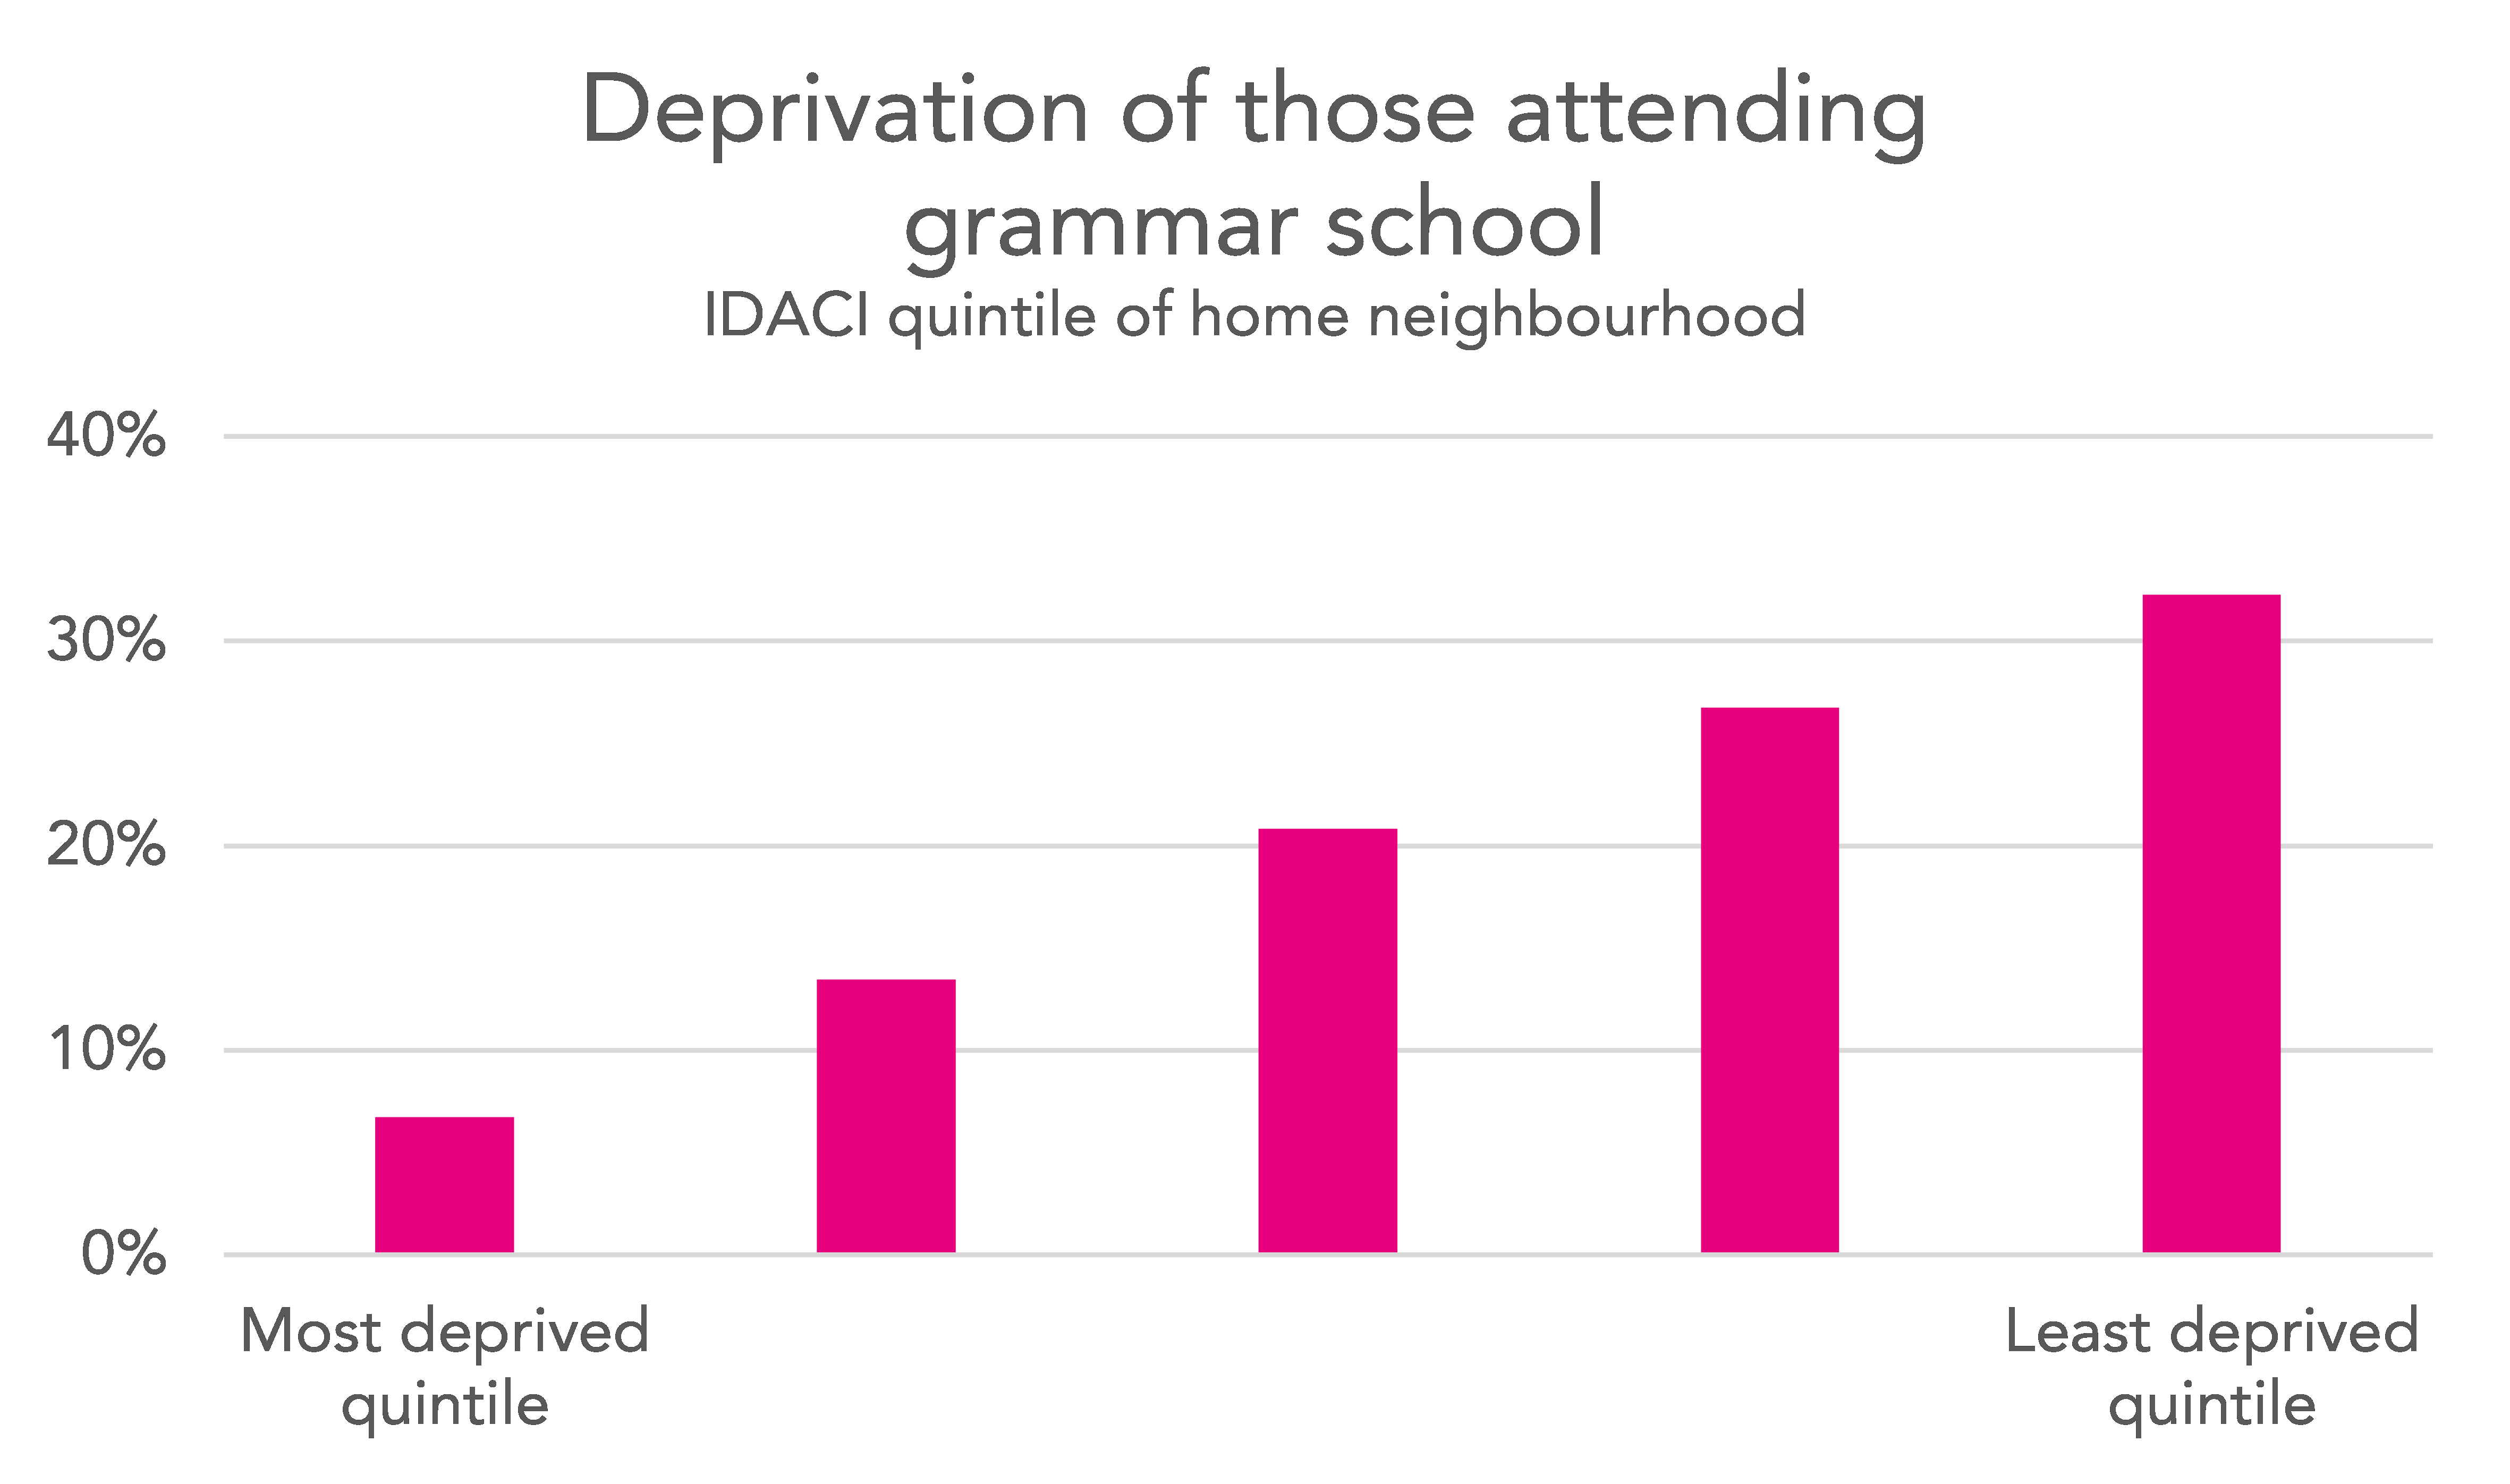
Finally, another way of looking at disadvantage is to look at IDACI – the income deprivation affecting children index – scores of the neighbourhoods from which children come.
Putting children into one of five groups, or quintiles, based on the IDACI score of the immediate neighbourhood that they live in shows that 7% of grammar school pupils were from the most deprived 20% of areas, with 32% from the least deprived 20% of areas. (Figures here are an aggregate of children who were in Y11 in 2012/13-2014/15, to minimise the number of small numbers encountered at a school level.)
Again, if we look at children how were in Year 7 rather than Year 11 at grammar schools in 2012/13-2014/15 we get similar figures: 8% of children appear to be from the most deprived IDACI quintile, and 30% from the least deprived IDACI quintile.
View the full, school-by-school data here.
Attainment of disadvantaged children
As we know, attainment at grammars is very good, both overall and for the relatively small numbers of disadvantaged children who go there.
Overall, 97% of children at grammar schools achieved five or more A*-C GCSEs including English and maths (5ACEM) in 2014/15. For disadvantaged children at these schools the figure was 93%.
At one grammar no pupils overall achieve five 5ACEM – presumably as a result of pupils taking an alternative to English GCSE that does not count in the DfE’s performance tables, for example. But besides this, disadvantaged pupil results at grammar schools start at 50%, but with 100% of disadvantaged children achieving 5ACEM at more than half of grammar schools and most of the rest in the 80-100% range. (For 49 grammar schools the numbers being talked about required suppression in performance tables.)
These figures are some way above what’s seen at top comprehensives, where 81% of children overall achieved 5ACEM, and 64% of those who are disadvantaged did. (Here we’ve taken the 200 comprehensive secondaries with the highest 5ACEM rates overall.)
But we need to remember they are exactly that: comprehensive schools. There intakes are enormously different to those of grammars in terms of prior attainment – something discussed extensively in our other writing on grammar schools.
And at those comprehensives that did best for their disadvantaged pupils – Ark King Solomon Academy and Bethnal Green Academy in London; Thomas Telford School in Telford; and the Archbishop Temple School in Preston – more than 90% of disadvantaged pupils achieved 5ACEM.
View the full, school-by-school data here and here.
Want to stay up-to-date with the latest research from Education Datalab? Follow Education Datalab on Twitter to get all of our research as it comes out.
1. These figures come directly from published DfE performance tables.
2. One small thing to note: local area figures are figures we have produced based on analysis of the National Pupil Database. Our definition of disadvantage here is just those pupils who are recorded as being FSM6 – so minus the (very small) number of children who have been looked after. If anything, this slightly reduces the disadvantage rates we’re recording at a local level, compared to the rates recorded for grammars.
3. Middle super output area – a smaller unit of geography than local authority districts.
4. One point to note here: from the National Pupil Database it’s not possible to tell definitively where a child has joined the state sector from the private sector. We think the vast majority of pupils who do not have Key Stage 2 results were probably at a prep school, as opposed to having been otherwise outside of the English state system – emigrating to England after age 11, say – so count all such pupils and add to this the number of children who we can see took KS2 tests at an independent primary school. It means these figures are an upper bound – but we don’t think the true figure will be much different.

Do you have data on how many disadvantaged learners with high KS2 scores gaining access to selective schools? How many of these learners are ‘missed’ by selective schools?
Hi Tim, we haven’t produced any figures on this combination of factors at a school-level as you very rapidly get into small numbers territory. But this previous post, where we look at these disadvantage and prior attainment, may be of interest: http://ffteducationdatalab.org.uk/2016/09/how-many-poor-children-do-we-want-to-go-to-grammar-school/.
Philip, Really interesting work – thank you. Your research is on similar lines to the Sutton Trust/CEM document http://www.suttontrust.com/wpcontent/uploads/2008/10/GrammarsReviewSummary.pdf
I note that this research identifies a gap of about 3.5% between high performing FSM attending selective and non-selective schools. Consequently, perhaps closing this gap is the first objective and the second more substantial issue to address is how we can improve outcomes for FSM/PP in the primary years.
Also, has the gap grown during the past eight years? Have the most selective schools (which were not grammar schools!) changed in their intake?
Finally, would it be easier to select students based on the new KS2 standardised system ie a score of 110 plus?
Has there been any research carried out on hidden barriers for disadvantaged pupils accessing grammar schools? If for example the 11+ needs to take place on a Saturday, has to be applied or the child needs to attend an unfamiliar setting many children from poorer backgrounds will be put off. There is also the ‘that school is only for the posh people’ factor which would also limit applications from certain groups of children. I am surmising therefore that those children who are disadvantaged and attend grammars are actually from aspirant families who believe in education and are therefore likely to encourage their child to attend whatever school they might attend. It has certainly been my experience that deliberate barriers to admission skew intakes so that more aspirant children attend, perhaps a far more reliable indicator (although difficult to measure) than any KS2 measure.