In the days of five good GCSE passes all students were equal: each child would contribute a one or a zero to the school’s pass rate, though of course it was easier for a school to get a pass for some students than for others.
Under Progress 8, the half a grade positive progress made by 27 students in a form class can get wiped out by three others who, for many reasons, fail to sit any GCSE exams[1].
Most GCSE maths candidates will be able to tell you that this is the problem with mean averages and is the reason why we avoid using them as descriptors in all sorts of circumstances – we tend to talk about median rather than mean pay, for example.
But how much of an impact might we be talking about in Progress 8?
Stripping out the outliers
There is, of course, going to be variation in the progress made by students within schools. But what we are interested in here is those schools where one or two students account for a large part of the deviations away from their P8 benchmark.
For most secondary schools[2], no single student makes a material contribution to their overall deviations from their P8 benchmark (i.e. their most atypical student accounts for 3% or less of total deviations across the school).
But for a small number of schools their most atypical students have a huge effect on their Progress 8 score.
We can see this by plotting each school’s Progress 8 score here against their score if we simply drop all students with P8 above +2.5 or below -2.5 – equivalent to a child being two and a half grades above or below what would be expected for them in each subject. (This analysis is based on provisional 2015/16 data from the National Pupil Database.)
The chart below shows that, in general, our judgement of which schools are doing well is not affected by these outlying pupils. But for those with very poor P8 scores, our judgements are substantially modified by removing some pupils.
It also isn’t the case that it is just the smallest secondaries that are affected: the school that we think sees the second biggest impact, with an improvement from a P8 score of around -1.2 to roughly -0.5 if outliers are removed, had a KS4 cohort of close to 200 pupils.

Where do we see outliers arising most?
The chart below shows that schools who are hugely affected by a few students with extremely low or high P8 scores are overwhelmingly schools with more disadvantaged intakes and who do not have high English as an additional language intakes.
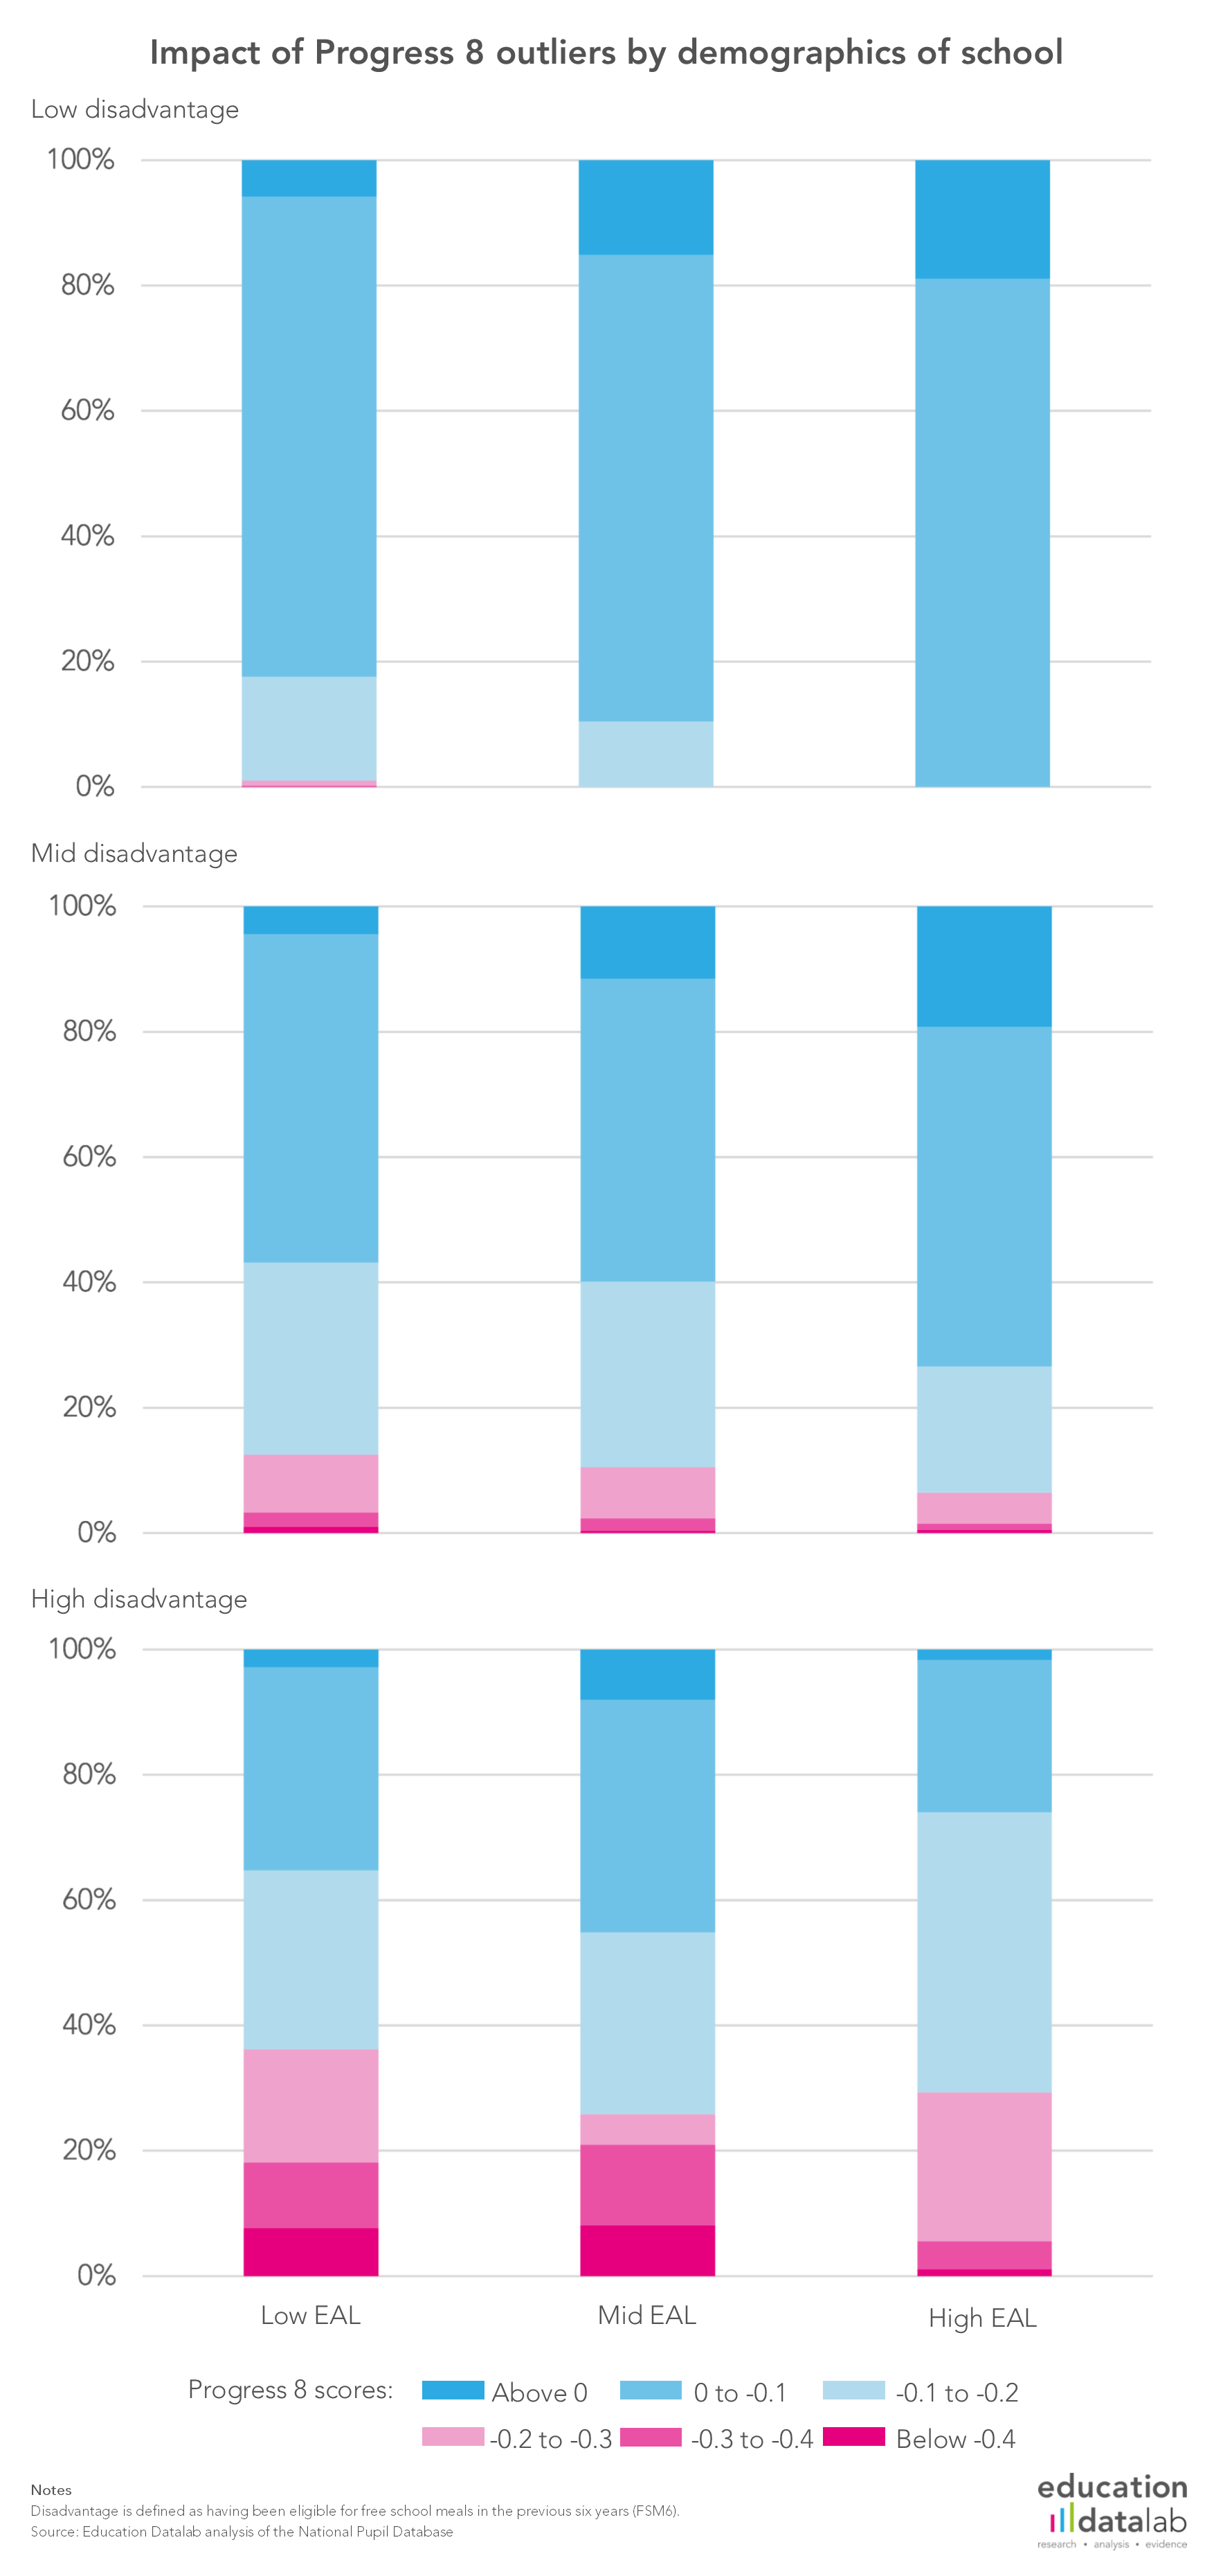
This shouldn’t be surprising. These outliers who vastly out- or under-perform our expectations given their Key Stage 2 results constitute 6% of disadvantaged students compared to under 2% of non-disadvantaged students (disadvantage here defined as having been eligible for free school meals in the past six years).
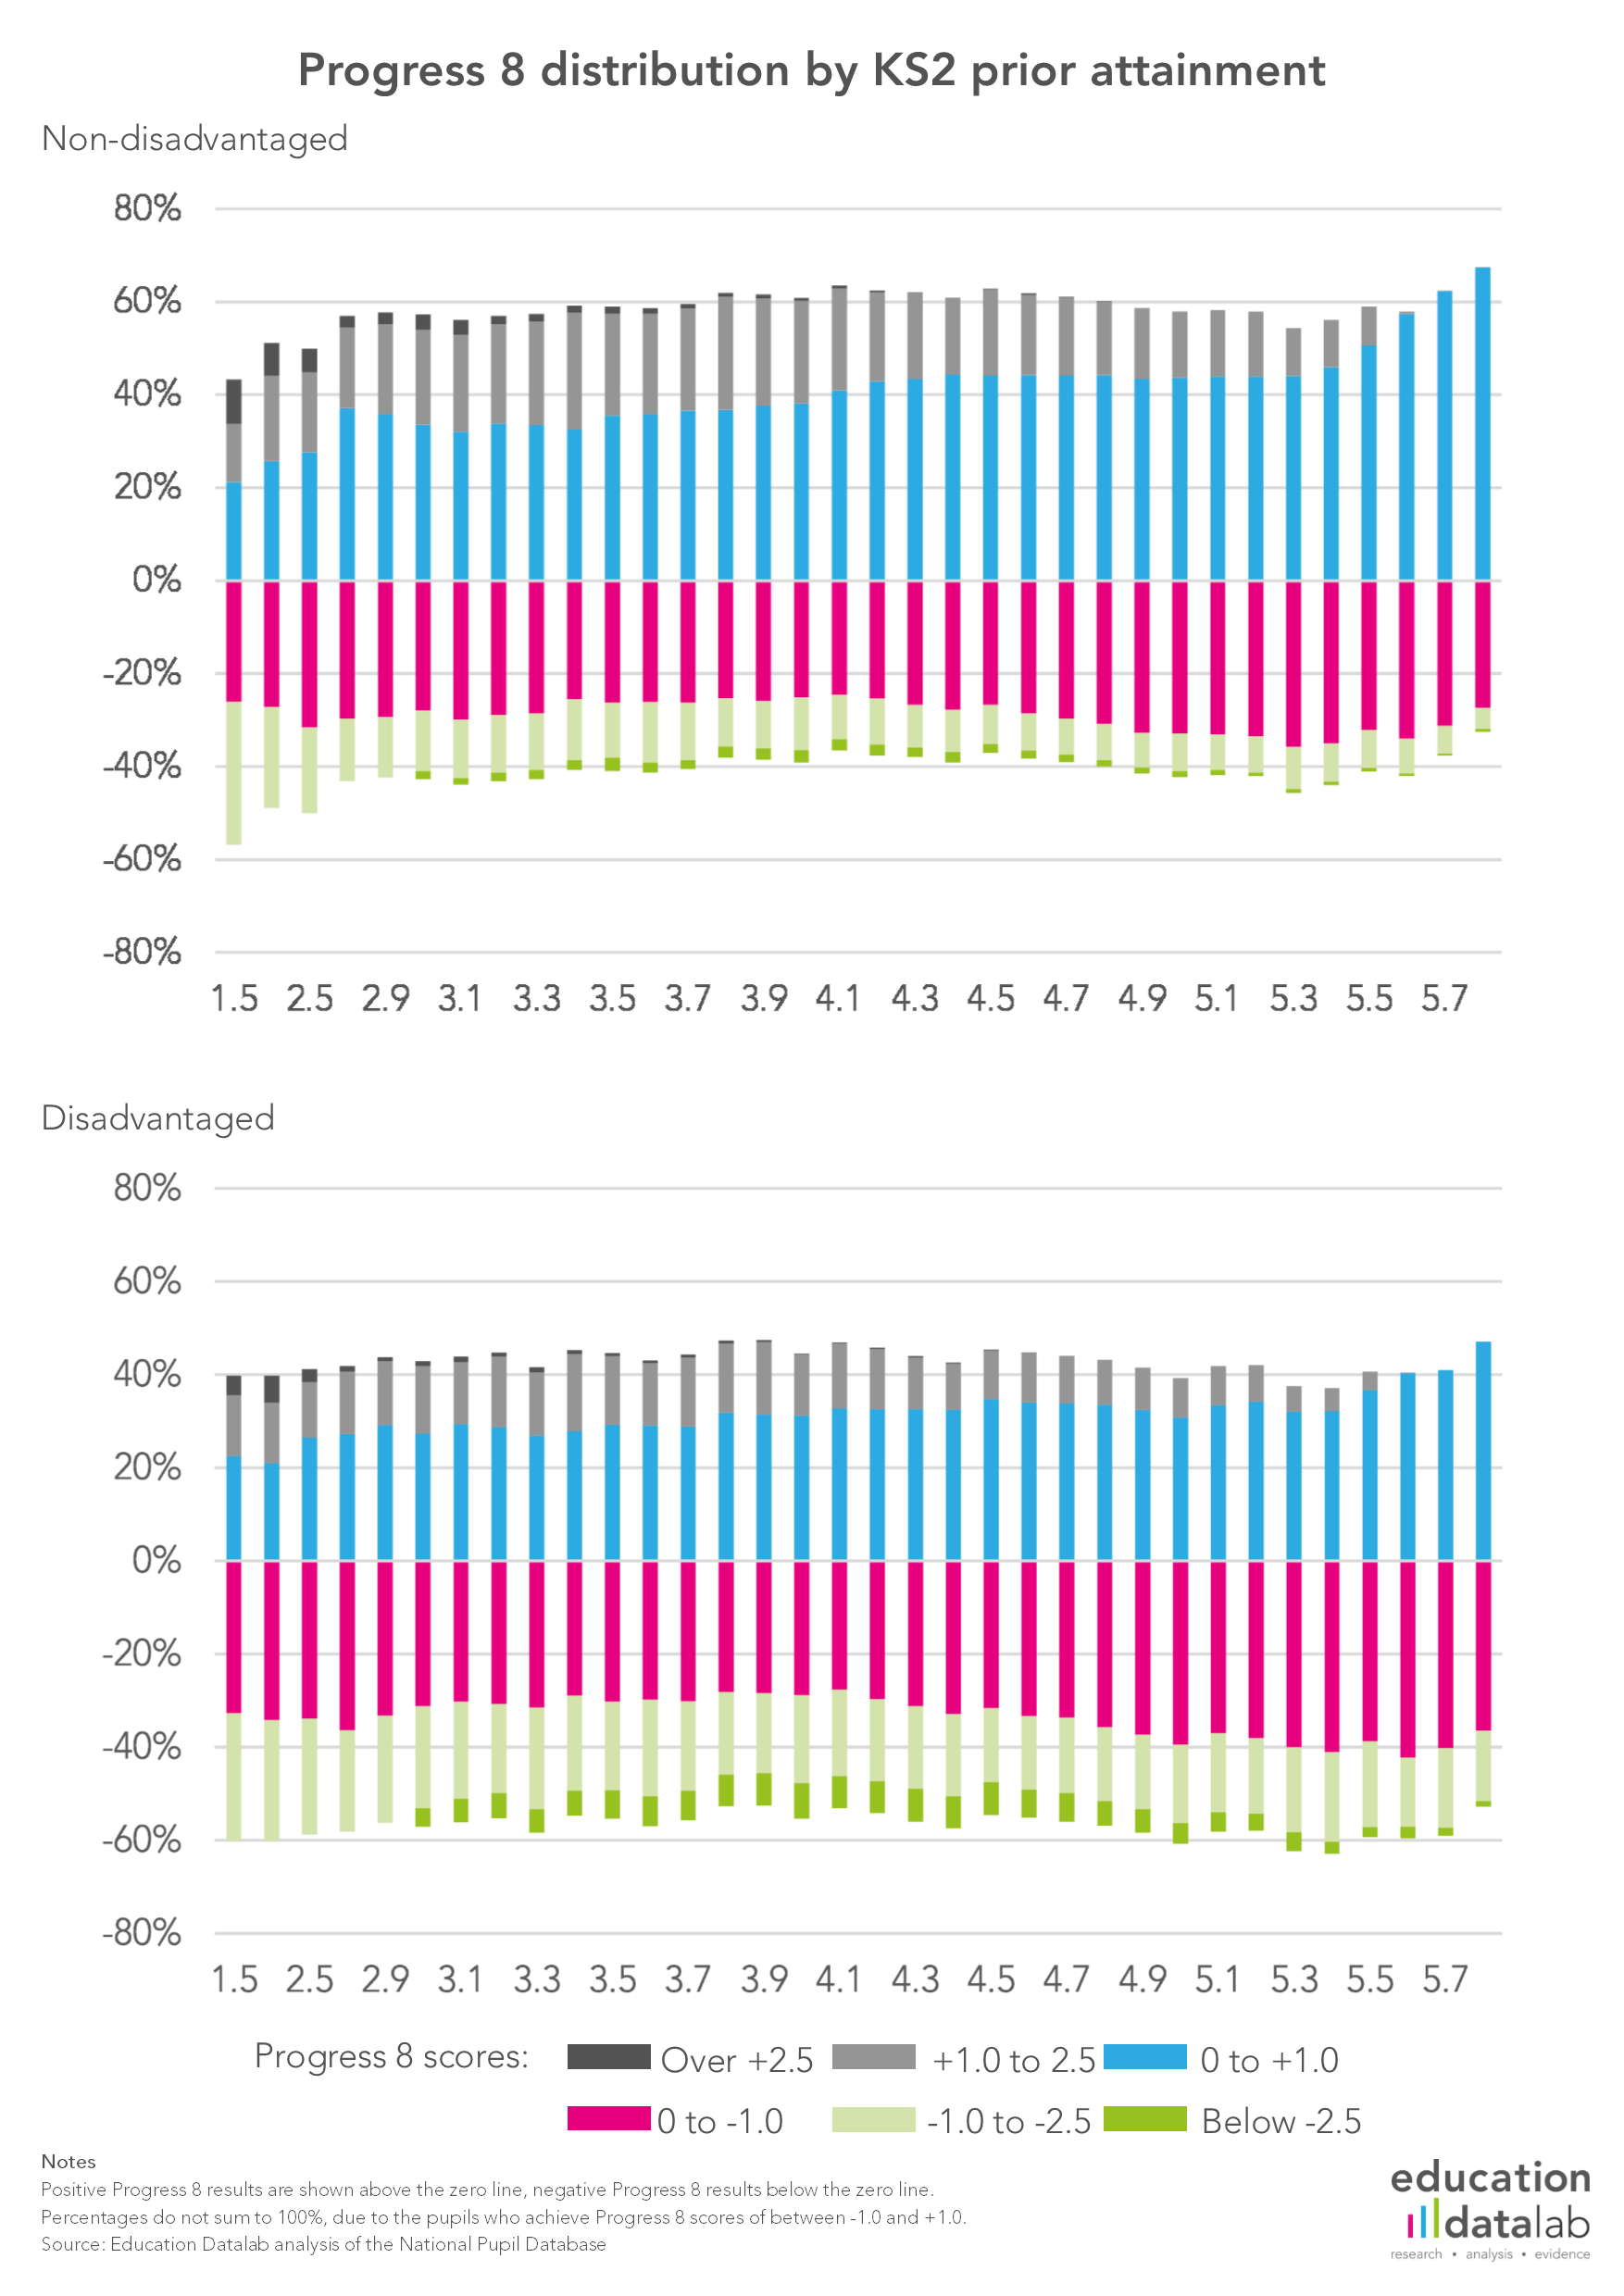
The chart below shows which types of students are most likely to miss their GCSE estimates.
It is only the very low prior attainment students who significantly overshoot their estimated performance by over 2.5 grades per subject. This reminds us that the end of primary school assessment framework is not really designed to assess academic capabilities at the very low end of the distribution.
But in terms of significant underperformance (the dark green bars), this happens across a wide range of prior attainment results, suggesting that there may be a group of pupils who simply aren’t turning up to take their GCSEs, regardless of the efforts of their schools.
The chart also shows that disadvantaged students at all prior attainment levels are considerably more likely to miss their target grades, compared to similar non-disadvantaged students.
Our decision about whether we could devise a modification to Progress 8 that better reflects school quality hangs on two questions:
- For students who significantly underperform their expected grades, would this have been likely to happen regardless of which school they went to?
- How can we ensure that schools have an incentive to ensure the best possible outcome for every single student, even those experiencing considerable difficulties in their lives?
The stories that headteachers share suggest that these underperforming children are usually experiencing overwhelming difficulties in their lives outside school and that the schools invest considerable time trying to get them into school regularly. So it isn’t that their future attainment is entirely outside the control of schools, it is more that schools simply do not have the resources to manage the situation adequately.
We need these students to be included in Progress 8. If not, then schools are not rewarded for the efforts they go to in trying to ensure they regularly attend school. One simple option might be to cap the scale of Progress 8 so that no student can fall below (say) -2.5 or above +2.5.
The story we tell about most schools would not materially change. But for 87 schools their Progress 8 score would improve by more than a tenth of a grade. And, based on this provisional data, we think around 50 schools would escape the floor standard (a similar number to that we reported using a different method last October).
Want to stay up-to-date with the latest research from Education Datalab? Follow Education Datalab on Twitter to get all of our research as it comes out.
1. We should note here that very few students score Attainment 8 score of zero – around 0.5-1% nationally. But these children are very unevenly distributed across schools, meaning it can be an issue for some individual schools.
2. We’re thinking here about mainstream schools with more than 60 pupils finishing Key Stage 4.

Leave A Comment