We thought we’d run out of things to say about Progress 8 but a couple of blogposts from Tom Sherrington and Jim Gordon last week made us realise that we hadn’t. Both examine, among other things, how Progress 8 scores vary by pupil and school characteristics.
(Progress 8 is the headline value added measure by which secondary schools are now being judged. To find out more about it, read our previous posts on P8 here.)
So in this post we take a look at how P8 scores vary by three characteristics – first language, pupil premium and Key Stage 2 prior attainment – as well as considering what difference a simple contextualised P8 measure might make.
Pupil characteristics
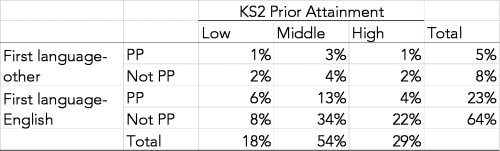
The pupil characteristics we use are crude categories that mask greater detail (Progress 8 scores for Pupil Premium pupils vary by length of time in receipt of free school meals, for example) but this notwithstanding we can divide pupils included in the 2016 P8 measure into one of 12 groups. The table below shows the percentage of pupils nationally in each group.
Pupils included in the 2016 Progress 8 measure by first language, pupil premium eligibility and prior attainment
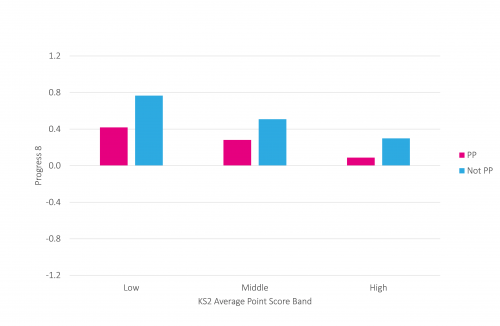
The two charts below look at the P8 scores of pupils whose first language is not English, and then those for whom it is English[1].
2016 Progress 8 scores, pupils whose first language is not English (all schools)
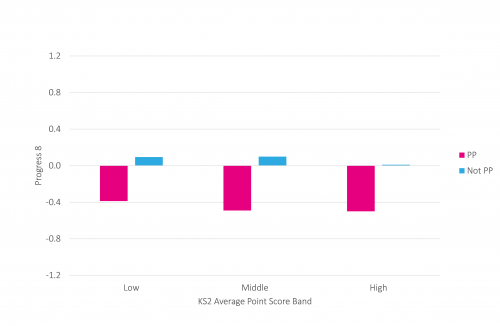
2016 Progress 8 scores, pupils whose first language is English (all schools)
Among pupils whose first language is not English, P8 scores tend to decrease with prior attainment. We might suppose that KS2 results tended to understate the true ability of some of those classified as having low prior attainment – perhaps if they arrived in the UK during Key Stage 2, for example. The difference between the Pupil Premium group and their peers is also narrower among pupils whose first language is not English than is the case for those whose first language is English.
Pupils eligible for the Pupil Premium whose first language is English tend to achieve lower P8 scores than other groups of pupils. These scores are broadly similar across all prior attainment bands.
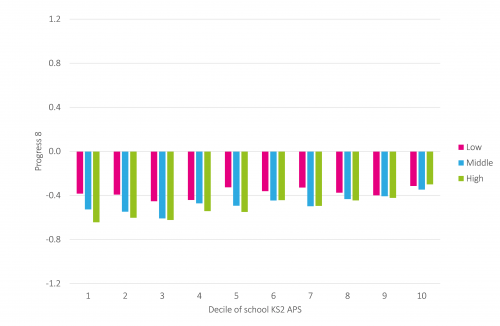
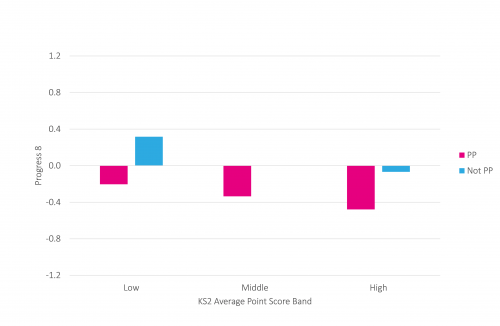
If we look at the performance of this group of pupils who are eligible for the Pupil Premium and whose first language is English in schools with different average KS2 intakes, we see that it is largely consistent among those with low prior attainment. However, those with high prior attainment tend to perform a fair bit better in schools with higher attaining intakes.
2016 Progress 8 scores by school KS2 average point score decile and pupil KS2 band (pupil premium pupils, first language English)
Schools below the floor standard
So far we have looked at all schools. But what if we just look at the nearly three hundred schools which fell below the government’s floor standard of a P8 score of -0.5 or lower?
Pupils included in the P8 measure at these schools are less likely to have a first language other than English (7% compared to an average of 13% for all schools) and more likely to be eligible for the Pupil Premium (41% compared to an average of 28% for all schools).
P8 scores for pupils whose first language is not English at these schools follows the same pattern as the national average although they are much lower.
2016 Progress 8 scores, pupils whose first language is not English (schools below the floor)
The P8 scores of pupils whose first language is English tend to be very low, particularly among those eligible for the Pupil Premium. On average, their P8 scores are a grade per subject below those of all pupils with similar prior attainment nationally (disregarding whether their first language was English or not).
2016 Progress 8 scores, pupils whose first language is English (schools below the floor)

For almost all of the 12 groups of pupils we have looked at based on KS2 prior attainment, Pupil Premium eligibility and first language, the average P8 score of those attending schools below the floor standard is 0.6 points below the group national average. We might therefore expect many of these schools to remain below the floor even if the P8 measure was contextualised.
Contextualising Progress 8
So let’s calculate a simple contextualised Progress 8 measure.
We could do this in a complex way and include a load of factors we know are associated with KS4 attainment such as gender, age and school moves.
Instead, we use a simple method here following the standard P8 methodology, but with separate tables of estimates of how we would expect children to perform at Key Stage 4 based on their first language and Pupil Premium eligibility.
The contextualised scores correlate highly at school level with published P8 scores (r=0.97).
However, the number of schools below the floor standard of -0.5 falls from around 300 (including closed schools) to 240. Of these 240, only 20 were not below the published floor standard.
For some schools (around 200 out of over 3,000) contextualising P8 in this way changes their score by 0.2 or more in either direction.
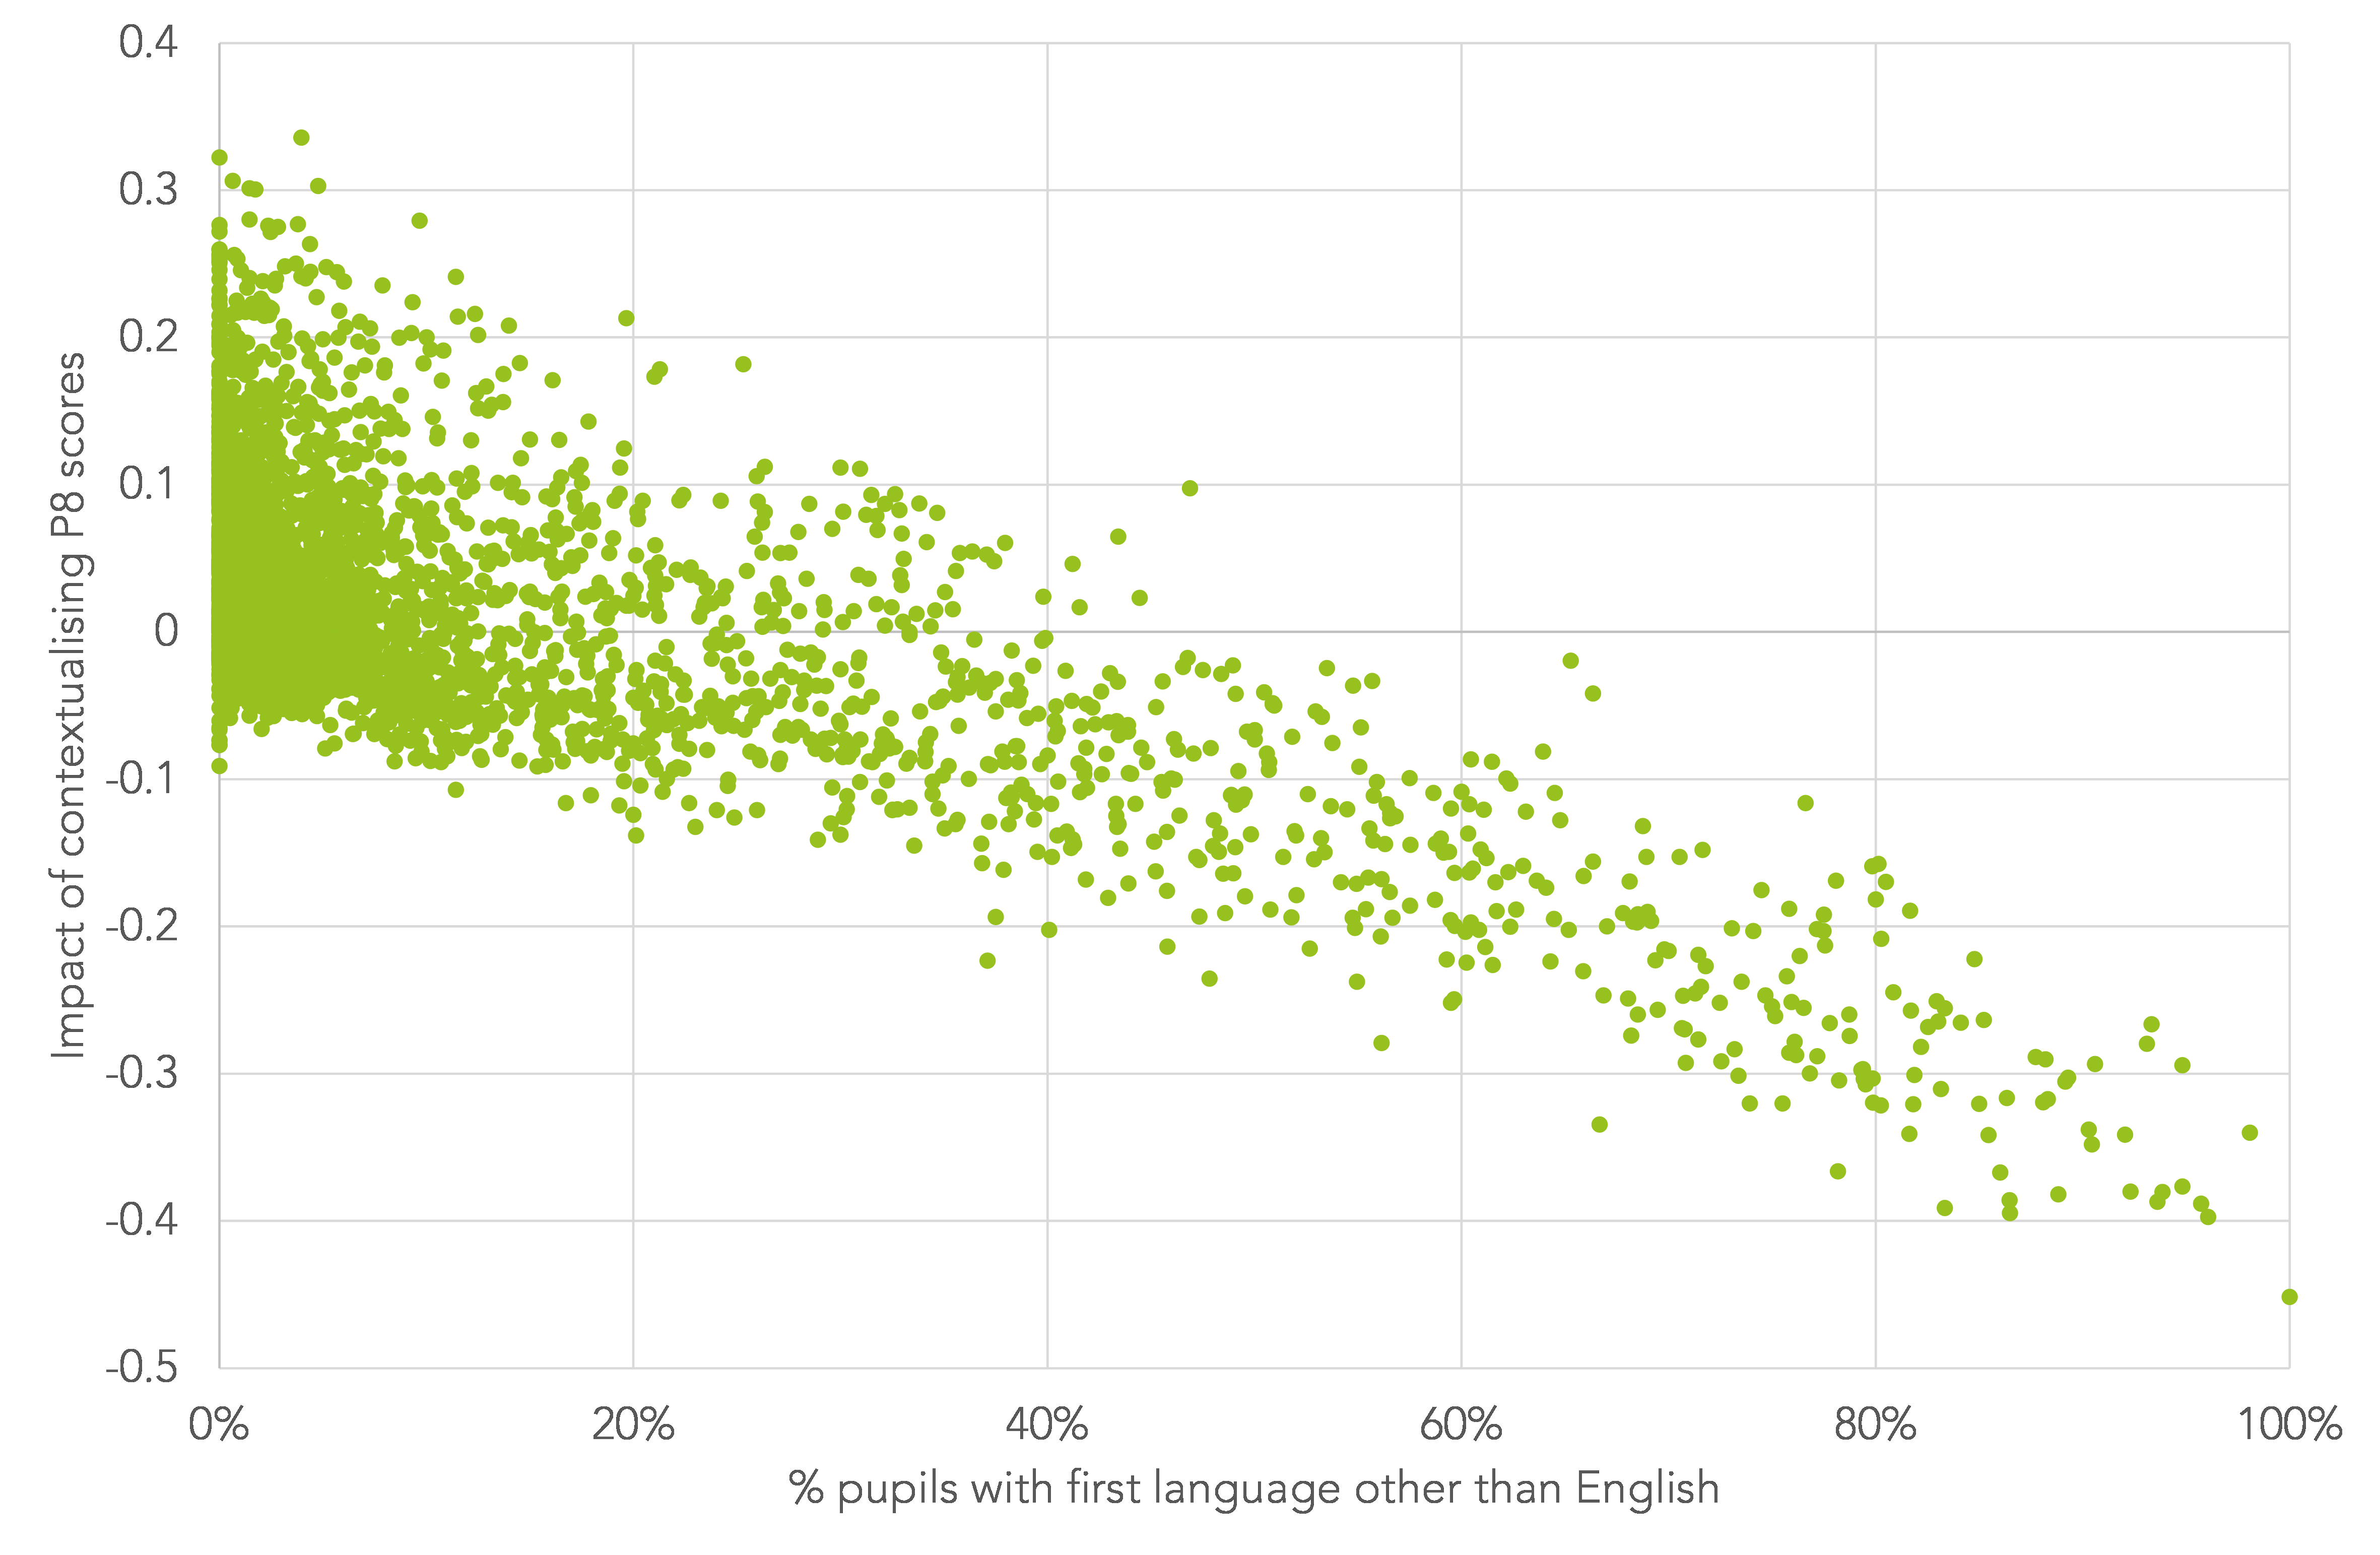
As the chart below shows, contextualising P8 tends to reduce the score of schools with high proportions of pupils whose first language is not English
Impact of contextualising Progress 8 by percentage of pupils with a first language other than English
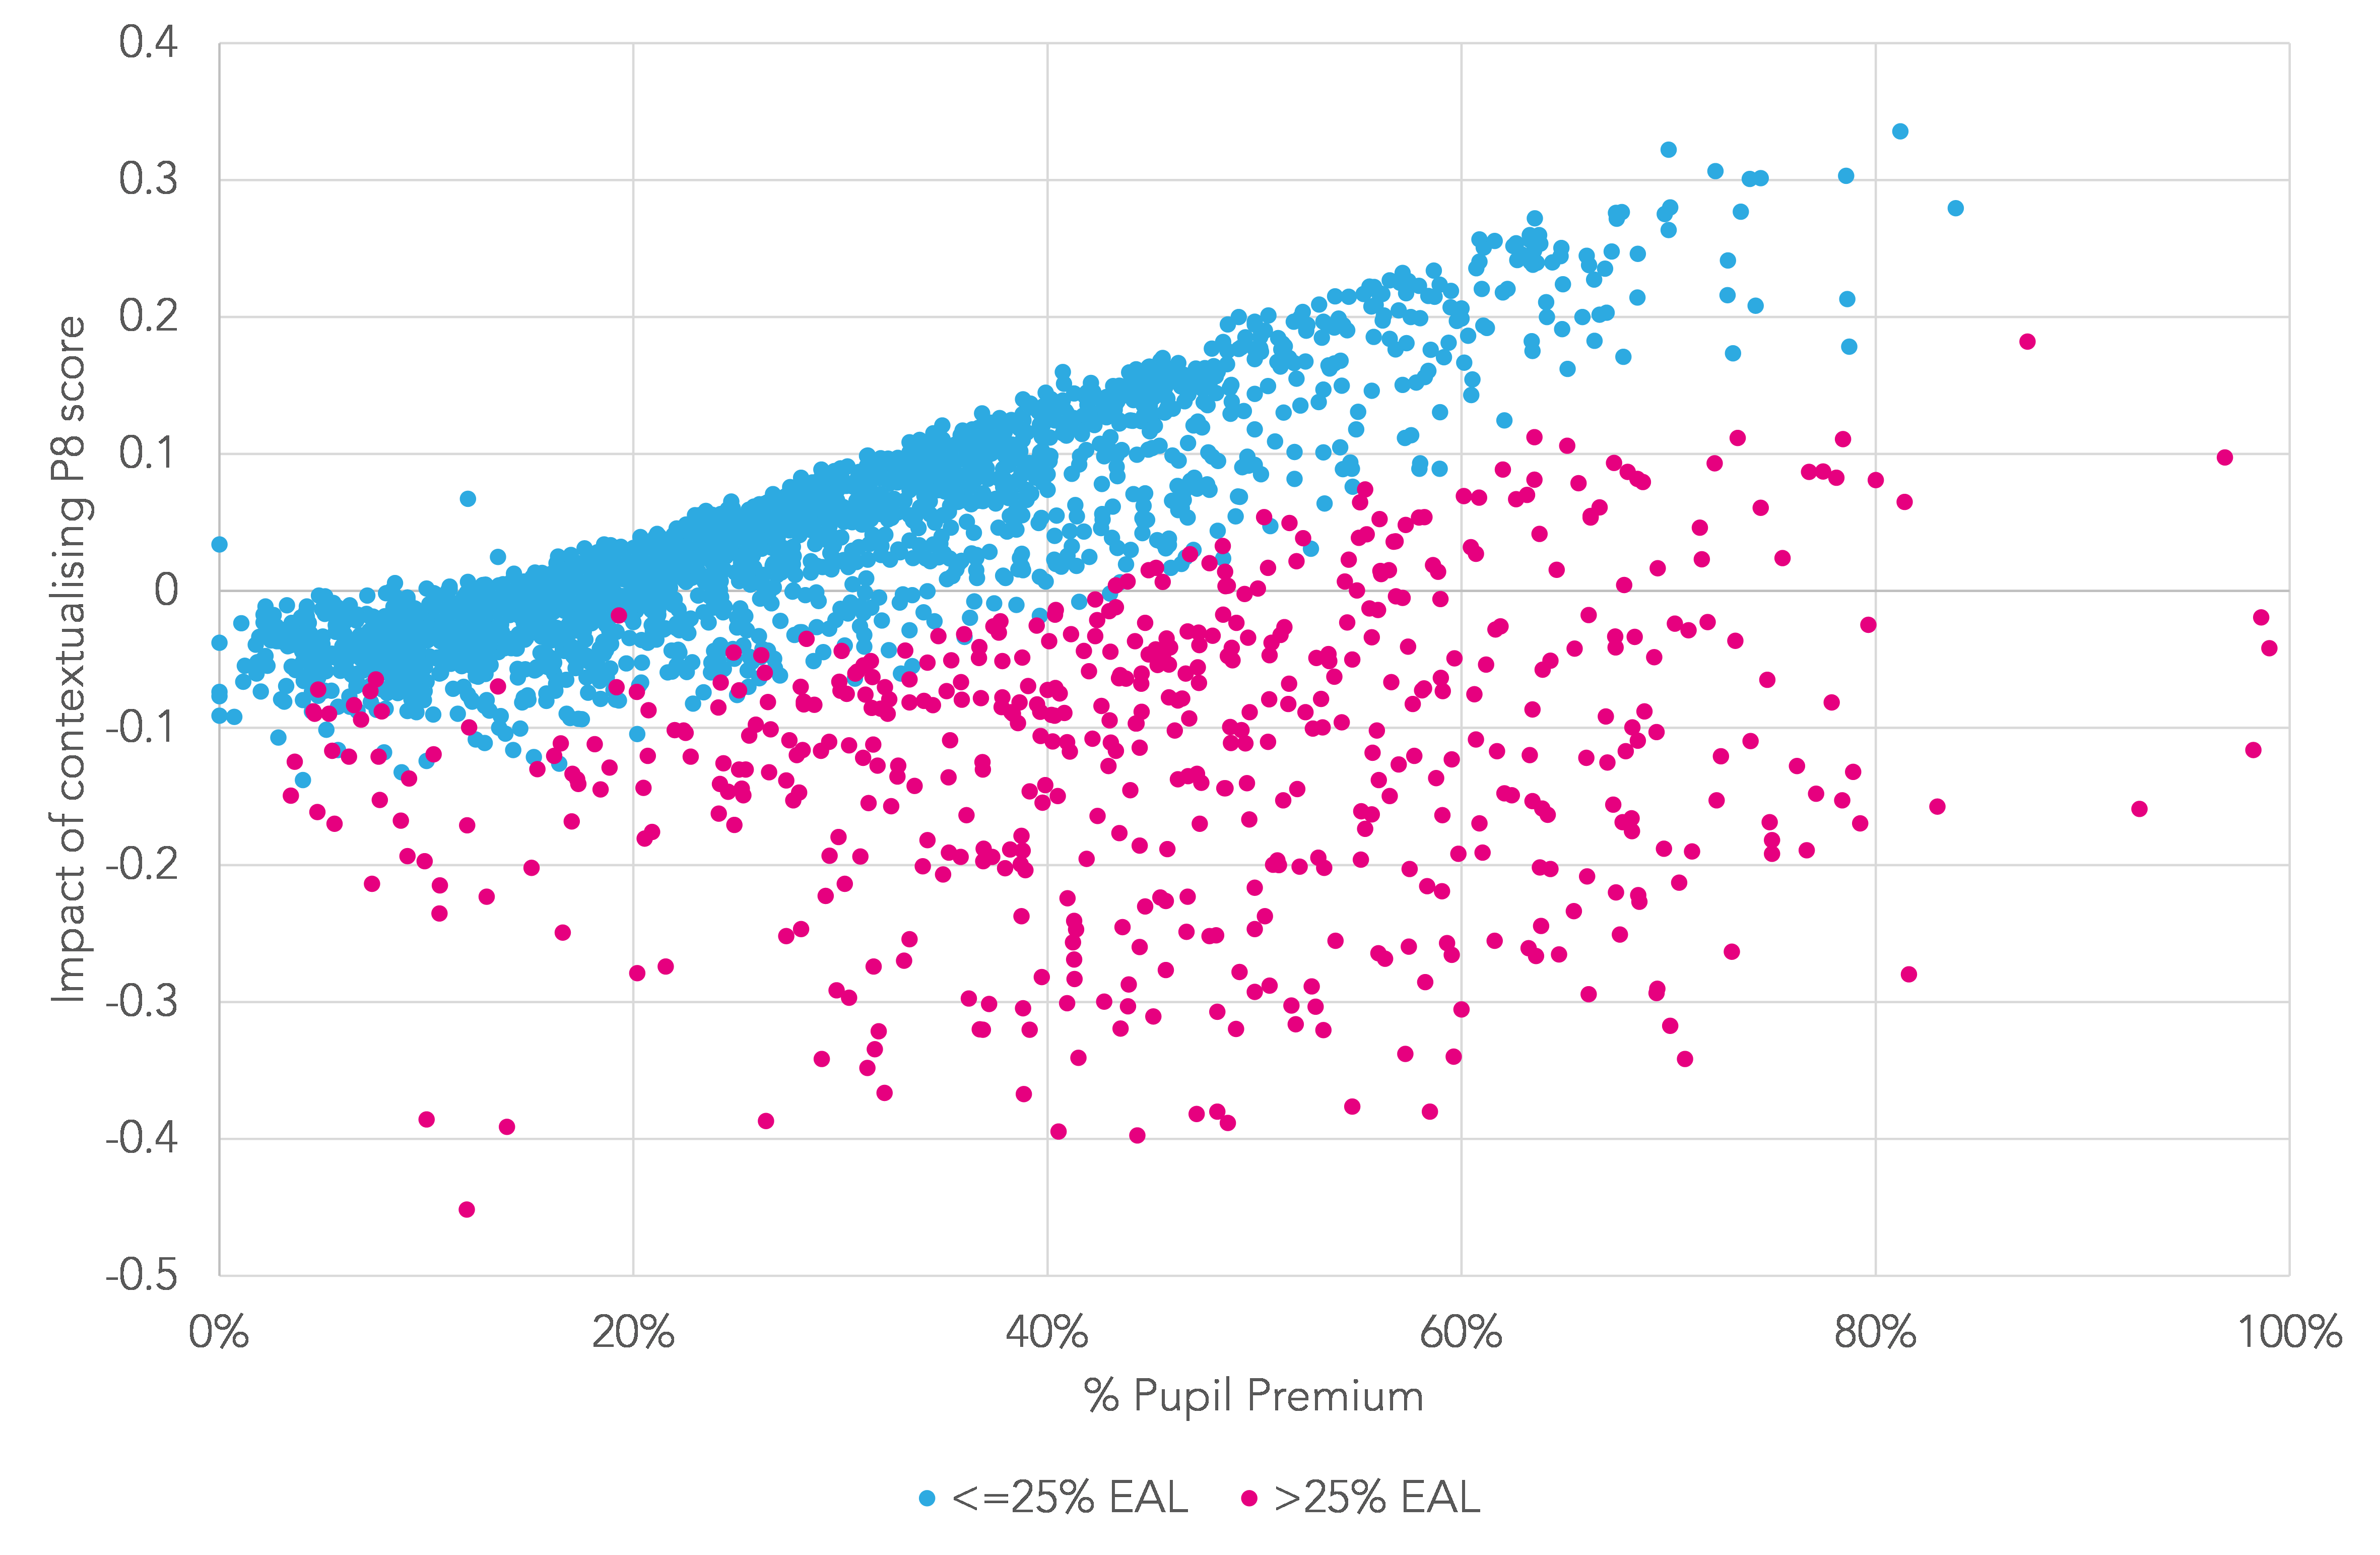
Similarly, schools with large percentages of pupils eligible for the Pupil Premium, particularly those with low percentages of pupils with a first language other than English, tend to see improved P8 scores after contextualisation.
Impact of contextualising Progress 8 by percentage of pupils eligible for the pupil premium
Final thoughts
The current P8 measure seems to be doing a reasonable job at identifying a set of schools where Attainment 8 scores are lower than might be expected given pupils’ Key Stage 2 results.
All the groups of pupils we looked at tended to under-perform in these schools. However, fewer of them would fall below the floor if Pupil Premium eligibility and first language were taken into account.
Most of the issues with P8 arise from using it as a measure of overall school quality. It isn’t. It’s just a school’s average Attainment 8 score adjusted for pupils’ Key Stage 2 attainment.
Contextualising P8 scores can lead to large changes for some schools. As we have said before (here and here) you cannot meaningfully compare schools with different types of intake.
If you’re not sure about this, think about a school you know and try answering this question: how would it have performed if it had a different type of intake?
Want to stay up-to-date with the latest research from Education Datalab? Sign up to our mailing list to get notifications about new blogposts, or to receive our half-termly newsletter.


Leave A Comment