This is part three in a series of posts exploring trends in attainment over time by month of birth. Other posts in the series can be found here.
The first two blogposts in this series showed that pupils’ attainment varies with their month of birth, with September-born pupils on average having higher attainment than those born in August, and with a steady change for the months in between.
Among the other findings were that:
- gaps were widest for Foundation Stage Profile (FSP), and reduced as pupils became older (Key Stages 1 and 2);
- for lower levels of attainment, the gap has been reducing over the past 10 years at both FSP and KS1;
- for higher levels of attainment, gaps don’t seem to have reduced in the same way.
This blogpost looks more at the closing of the gap at FSP and, from this, arrives at some important conclusions for the use of different types of attainment indicators.
Types of indicators
To understand the closing of the gap at FSP we need to understand differences between:
- threshold measures, i.e. the percentage of pupils attaining at, or above, a given level;
- points-based measures, i.e. an average score attained by all pupils.
Of the two, threshold measures are a poor measure of changes in the attainment of all pupils because they focus only upon one group of pupils – those attaining just below the threshold.
Why is this important? As an illustration we can look at a threshold indicator we created in the second blogpost in this series, FSP2b. We defined this as the percentage of pupils with an FSP score of 76 or higher (pre-2013 – the period which we will focus on).
In 2011, 90% of September-born pupils reached this threshold; for August-born pupils the figure was 70%.
And in 2012, 91% of September-born pupils reached our FSP2b standard, while 73% of August-born did.
The gap between September- and August-born pupils therefore reduced by 2 percentage points (from 20% to 18%).
The table below looks at these pupils in more detail.
It shows the proportion of children who are considered to have attained our FSP2b standard, having achieved an FSP score of 76 or higher.
The next column shows the percentage of pupils who scored precisely 75 – i.e. one mark below the threshold we have set.
Meanwhile the final column shows how many children would have been considered to have achieved the FSP2b measure if all pupils had scored one mark more.
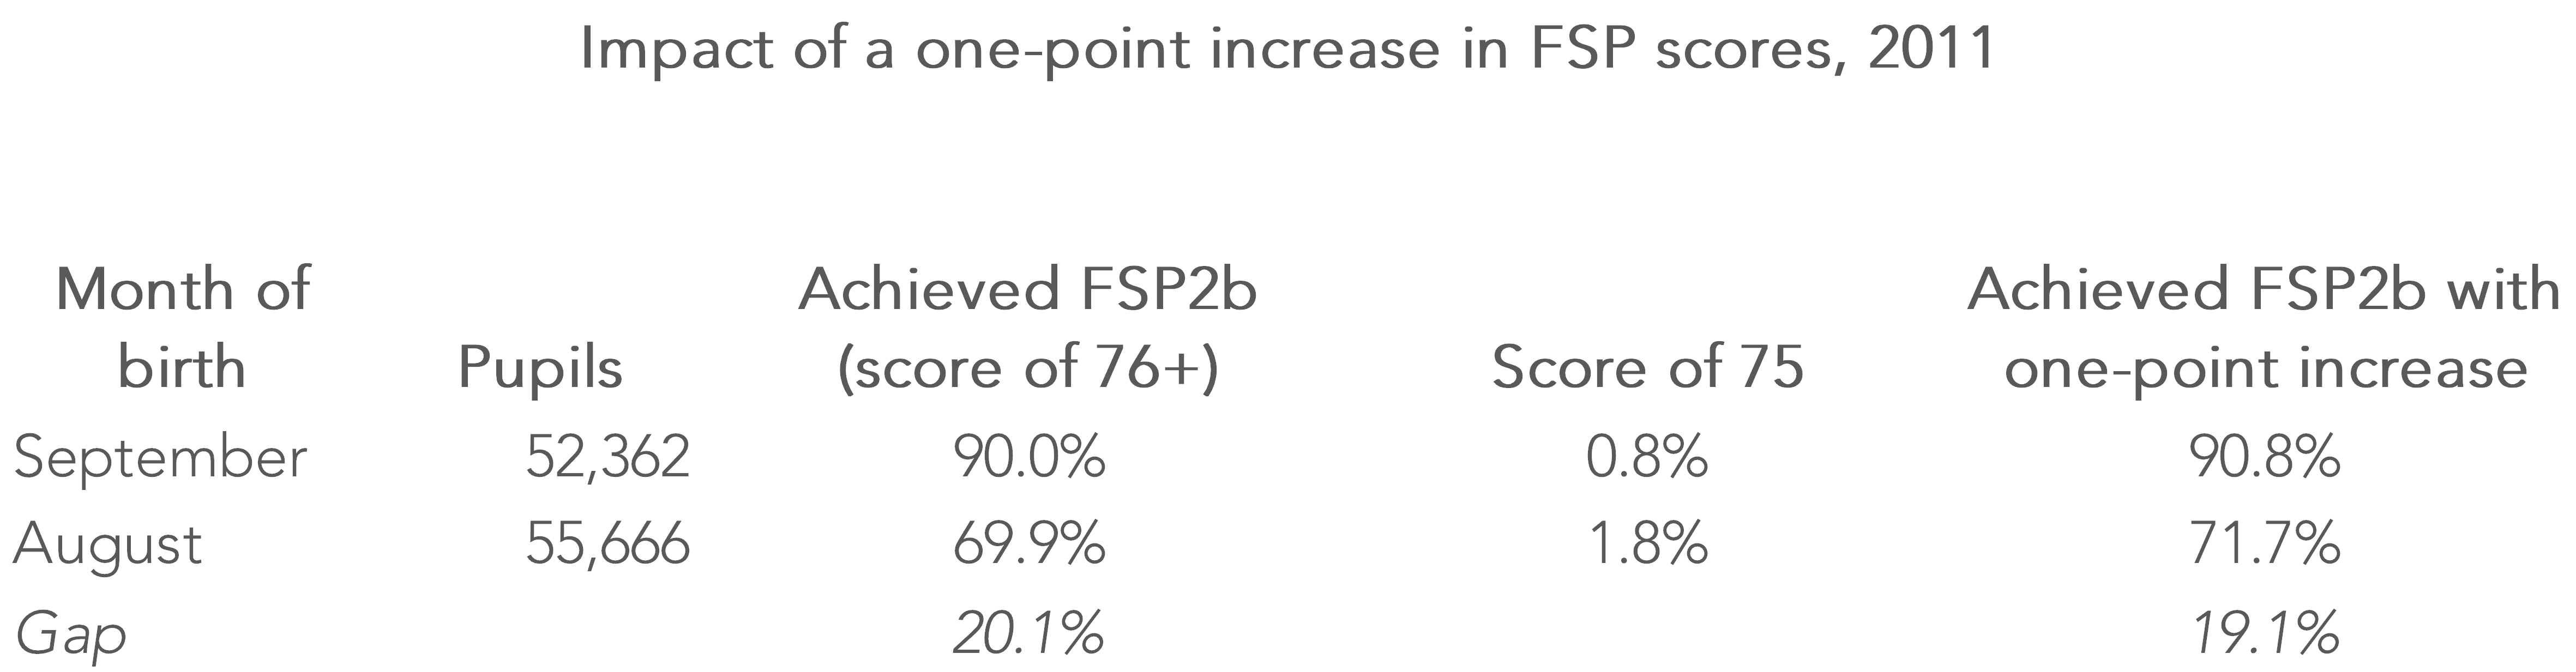
As is clear from the ‘gap’ row, an increase of one mark in the score of every pupil would reduce the gap from 20% to 19%.
That is, increasing the score for every single pupil by one actually reduces the September-August gap.
How can this be, when we have increased the score for all pupils by the same amount? It is because of where different groups of pupils are on the overall distribution of marks.
There are more August-born pupils (30.1%) below the threshold than there are September-born pupils (10.0%), and, critically, 1.8% of August-born pupils are one mark below the threshold, compared to 0.8% for September-born pupils. So, increasing the score for all pupils by one moves more August-born pupils over the threshold.
Observing this in the real world
The average score for all pupils at FSP increased from 87.5 in 2011 to 88.5 in 2012 – in increase of one point.
So why did the September-August gap actually close by 2 percentage points?
This happened because the increase in average score was not spread evenly – the average score for August-born pupils increased by slightly more than for September-born pupils. The chart below shows the average increase seen for each birth month.
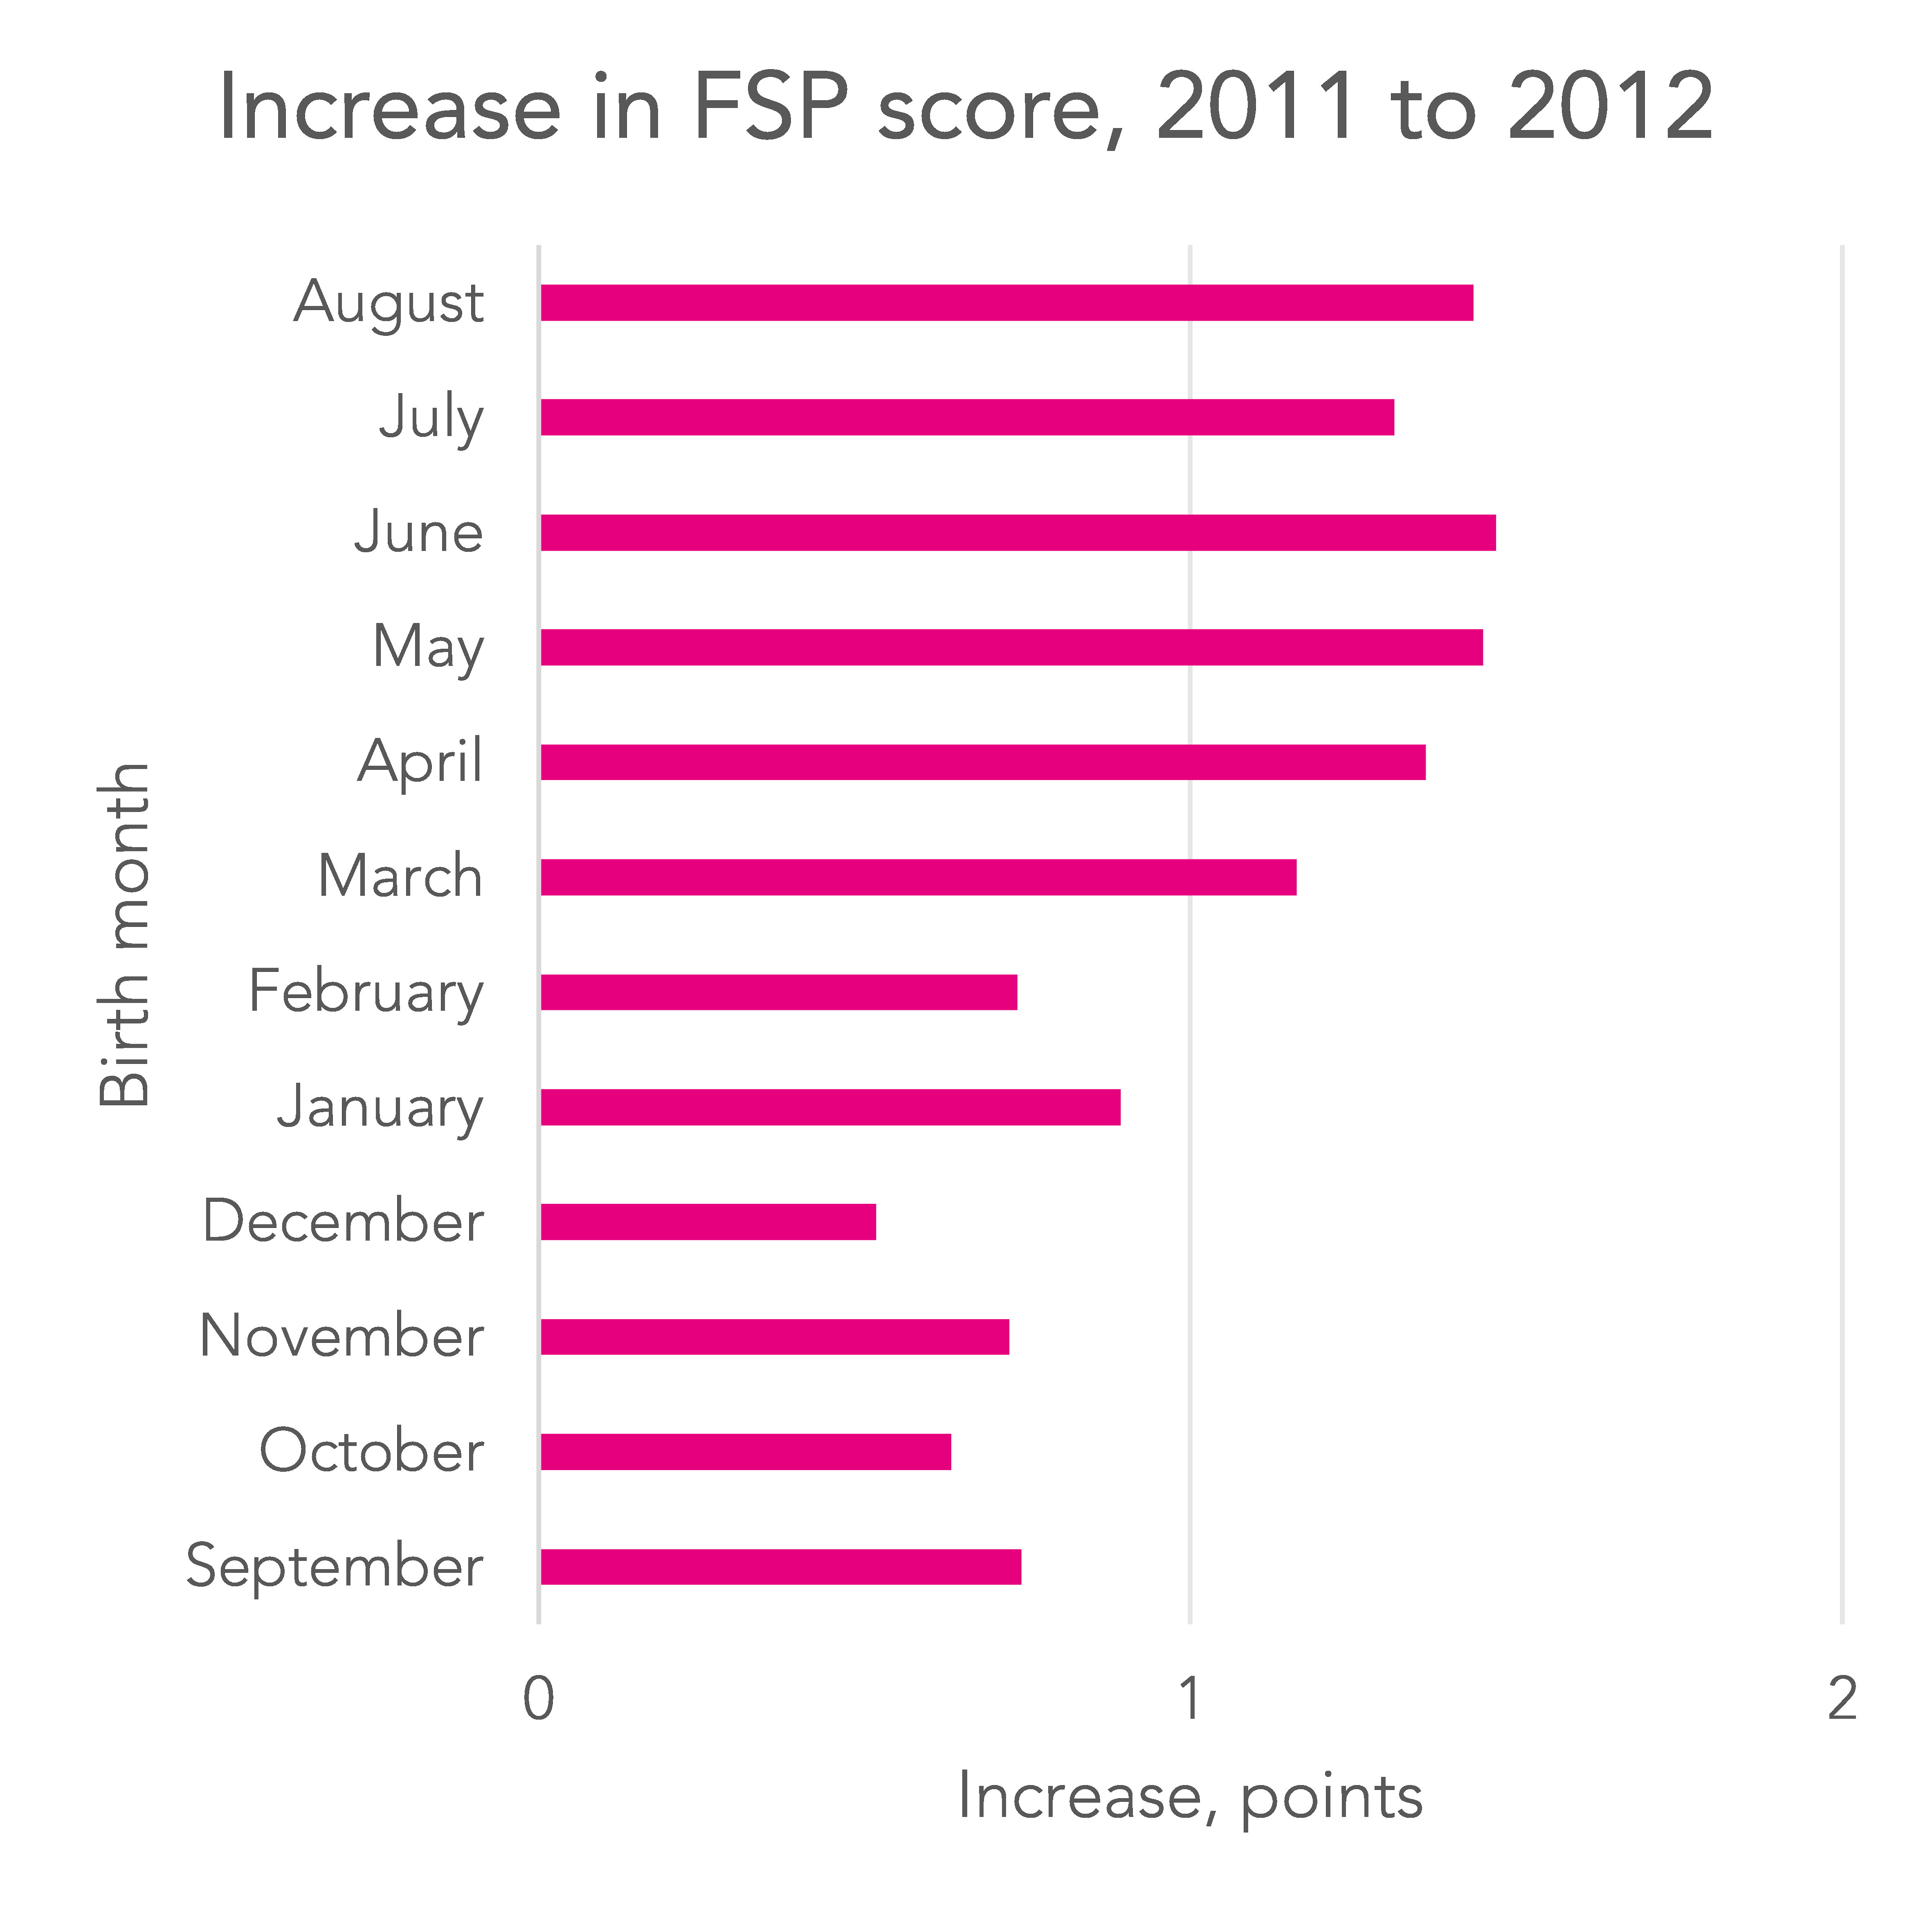
Such a pattern of increases – rather than a flat one point increase for all children – does indeed lead to a decrease of 2 percentage points in the September-August gap for FSP2b that we observed.
What can we conclude from this?
So, what conclusions can we draw?
The first is a positive one, and is that the narrowing of the month-of-birth gap observed at FSP is not entirely explained away by there being more summer-born pupils just below the threshold level to begin with.
Our analysis would suggest that about 50% of the reduction in the age gap has been caused by improvement in the underlying score, and points-based indicators such as average total FSP score seems to bear the fact that there has been a real change in the relative attainment of autumn- and summer-born children out.
The remaining 50% of the reduction in the age gap is simply a consequence of there being more summer-born pupils below the threshold level.
But given that targets for FSP have focused heavily on the percentage of pupils reaching a good level of development we should not be surprised to find that there has been more improvement for pupils below the threshold.
Will the improvements at FSP and KS1 feed through into later Key Stages? We will need to wait for a few years to find out.
The second, much broader, and potentially more important conclusion, is that comparisons of the performance of groups of pupils can give inaccurate conclusions if we look only at threshold indicators.
As we have seen, an increase in each pupils’ score by the same amount can lead to a reduction in month-of-birth gaps when we are looking at threshold measures – even though there would have been no change in the gap seen in points-based measures.
This conclusion has implications for any analysis – not just of Foundation Stage Profile data, and not just when analysis is done by month of birth. It could affect, for example, analysis of different groups of pupils reaching the expected level at Key Stage 2, or achieving grade C or higher at Key Stage 4.
Threshold indicators and targets can focus attention upon pupils just below the threshold – but they are, on their own, a poor tool for detailed self-evaluation. A subject for further investigation, perhaps?
Want to stay up-to-date with the latest research from Education Datalab? Sign up to our mailing list to get notifications about new blogposts, or to receive our half-termly newsletter.


Leave A Comment