Last Thursday at the Festival of Education, Sam Sims and I presented new research from our forthcoming book, The Teacher Gap, on the small number of schools that appear to be knowingly running a recruit-burnout-replace staffing model.
The talk was written up by Schools Week and you can read the whole story of these teachers when our book is published. In this short blogpost I wanted to explain how we decided whether a school’s use and loss of Newly Qualified Teachers (NQTs) was particularly worthy of further investigation.
Funnel plots as a monitoring tool for NQT experiences
About 4% of teachers in the profession are NQTs in any one year. The proportion of teachers at a school who are NQTs and the proportion of NQTs who are lost by a school at the end of year will clearly vary significantly across schools. Because the number of teachers in a school can be quite low, the variation that should be attributed to chance, or ‘common cause’ variability, might be quite high. We are only interested in the variation that is likely to be systematic.
The figure below plots the proportion of teachers who are NQTs at a school against a count of the number of teachers in the school between 2010 and 2014 for each secondary school in the North West (we count each year so if a school typically employs 100 teachers then its count over five years will be about 500). If we assume that there is a fixed chance that each teacher employed is an NQT (i.e. a binomial draw) then it follows that small schools will see greater variation in the proportion of their teachers who are NQTs.
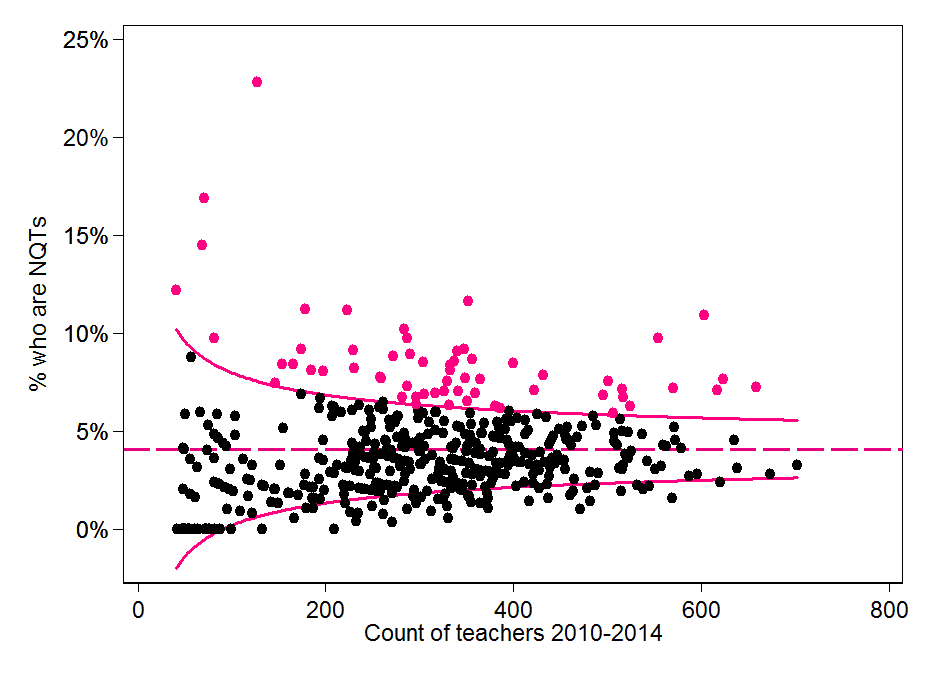
Proportion of teachers who are NQTs at a school over a five-year period (secondary schools in the North West region)
The funnel plot lines drawn on the chart show the ‘control limits’ within which the NQT proportion at a school is consistent with chance. (In fact even with chance occurrence you would expect 5% of schools to be plotted outside the control limits). Those above or below the funnel plot lines are schools where the NQT proportion over this 5-year period seems unusually low or high, and is therefore worthy of investigation to understand why. We show the control limits here at 5% (i.e. draws from a random distribution will fall within the lines 95% of the time) but any limits can be shown depending on the balance of misclassification desired. The chart shows that just 60 of 458 (13%) schools appear to have systematically high use of NQTs over 5 years – in a random distribution we would expect to see 11 (i.e. 2.5%) schools above the control limits.
David Spiegelhalter introduced the idea that these funnel plots are useful graphical tools for making meaning institutional comparisons in the health care sector, and we have written about them before. They avoid ‘league tables’ where the variation in data simply does not warrant them. The funnel plot above clearly reveals that most schools lie within the 95 per cent limits, thus any variation between them is likely due to chance alone and so there is no basis for ranking the schools.
We can draw similar funnel plots to see whether these secondary schools in the North West have unusually high loss of their NQTs at the end of this first post-qualification teaching year. The chart below shows that just 22 of the 458 secondaries in the North West have loss of NQTs that is more than we would expect through chance alone, given a common cause process. This is twice as many as the 11 schools we would expect to see with unusually high loss of NQT by chance alone.

Proportion of NQTs who leave a school over a five-year period (secondary schools in the North West region)
Comparing use and loss of NQTs to define sausage machine schools
For a school to have data that makes it look like a sausage machine school we need to see:
- Sustained high use of NQTs over a five-year period; and
- Sustained high loss of NQTs at the end of their year, either to other schools or to the profession altogether.
We found fewer than 200 schools like this, located all over the country, as we show on this map. The data gives us cause for concern that they are providing poor working conditions and support for novice teachers, but of course we can only learn this by visiting the schools. It might not surprise you to learn that schools who have failed their Ofsted or who serve very disadvantaged communities are more likely to be possible sausage machine schools. We wouldn’t take this to mean that quality of support and management is weaker in schools in disadvantaged areas – it may simply be that quality of leadership is less important to novice teachers who go to teach in schools in more affluent areas.

Map of possible sausage machine schools, based on teacher employment data between 2010 and 2014
By pooling five-years of data in these examples we are looking for persistent longer-term patterns in the retention of NQTs. Using just one year of data is just as possible using these funnel plots because the greater variability in the one-year retention rates across schools is reflected in the wider funnel plot ranges of expected variation.
It is easy to interpret the ‘common cause’ variation in NQT use and retention as ‘normal’ and therefore state that it is inevitable that almost one-in-ten leave the profession . This is not the correct interpretation. If we chose to improve support and working conditions for NQTs then attrition might well fall across most schools, thus setting ‘normal’ expectations at a lower level.
We repeated this process for every region, separately for primary and secondary schools. By running these 18 separate phase and region of school analyses, we are implicitly assuming that all schools within the same phase and region are subject to similar ‘common cause’ teacher labour market processes. This may not be a decent working assumption; I suspect schools in more disadvantaged coastal parts of the southern England would claim they cannot possibly share the teacher recruitment and retention conditions of more affluent schools in their region. But in our view, these policy questions of whether or not to restrict comparisons to schools operating in similar social circumstances are not quite the same as the debates we have about measuring pupil attainment. If a school is using up a large proportion of our graduating NQTs and then losing them from the profession at the end of the year, we would want to intervene to stop it happening, regardless of underlying cause.
We talk about policies to improve the experiences of NQTs in our forthcoming book, The Teacher Gap.

Leave A Comment