Provisional KS2 data 2017: Five key points from today’s release

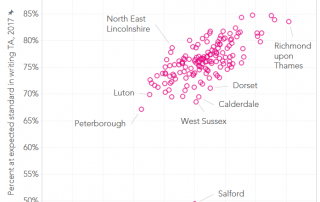
1. The percentage of pupils achieving the higher standard has increased We already knew that the percentage of pupils achieving the expected standard in reading, writing and maths increased from 53% last year to 61% this year. And today’s release of provisional Key Stage 2 data shows that the percentage reaching the higher standard increased [...]

By |2017-12-20T13:23:44+00:0031st August 2017|Exams and assessment, School accountability|

GCSE results day 2017: It’s all about the (lack of) money, money, money

In England, the government has been trying to push schools into raising entries in the so-called EBacc subjects through its accountability metrics: the percentage entering and achieving the EBacc, and Progress 8. This is one reason why subject entries have been changing so much in recent years. However, another reason why they are changing is [...]

By |2017-12-13T19:12:12+00:0024th August 2017|Exams and assessment, School accountability|

A-Level results day 2017: A look at changing grade distributions

We looked at some of the main A-Level results trends this morning, and separately we have looked at how results changed in subjects that have been reformed (in brief: attainment fell slightly). But there are a couple of other interesting trends in grade distributions to be drawn out. Some specific subjects are seeing quite large [...]

By |2018-09-27T17:34:16+01:0017th August 2017|Exams and assessment, Post-16 provision|

A-Level results day 2017: The impact of reform in England and Wales

A massive 59% of A-Level exams sat in England this year were in reformed subjects which follow the new, linear model of sitting one set of exams at the end of the two-year course. Overall, and perhaps surprisingly, A-Level entries by 18-year-olds in reformed subjects increased by 2.3% in England. This compares to 0.7% in [...]

By |2018-09-27T17:34:43+01:0017th August 2017|Exams and assessment, Post-16 provision|

A-Level results day 2017: Is it the end of the road for AS-Levels?

Last year, we reported on entries and grades in the first set of AS-Levels to be reformed. Compared to 2015, entries fell in all subjects, ranging from 11% (business studies) to 33% (art and design). This year, more subjects have been reformed and decoupled from A-Levels. Data published by Ofqual earlier in the summer showed [...]

By |2018-09-27T17:35:20+01:0017th August 2017|Exams and assessment, Post-16 provision|

Can we compare the A-Level performance of independent schools and state schools?

Last week the TES ran a story based on some research by Tom Richmond [PDF] comparing the A-Level value added scores of independent schools and state schools. In the story, the average value added score for the 10 highest attaining independent schools was given as 0.19, and for the 10 highest attaining non-selective state schools 0.26. [...]

By |2018-09-27T17:35:55+01:0014th August 2017|Post-16 provision, School accountability|
Go to Top