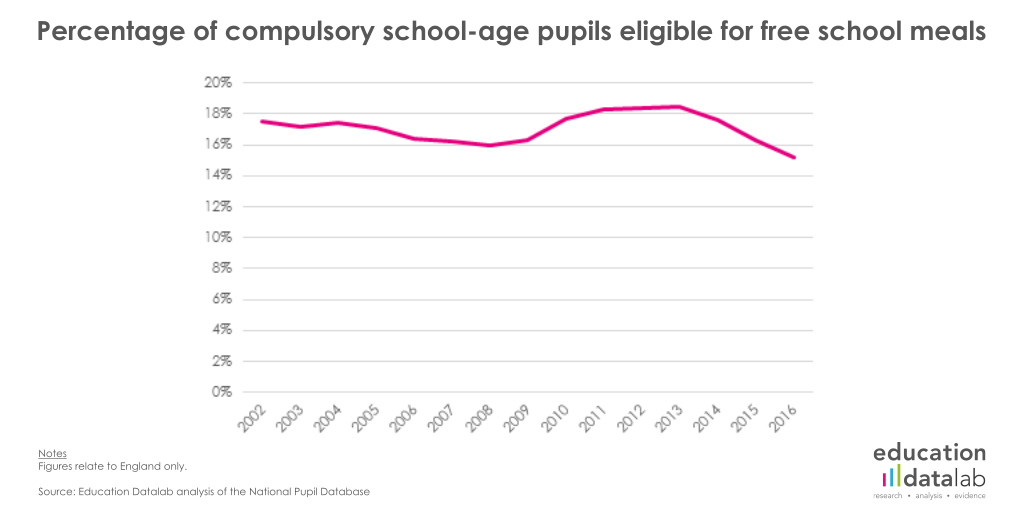
One of the most interesting figures in Tuesday’s statistical first release on pupils in state-funded schools was the fall in the percentage of pupils eligible for free school meals to the lowest level recorded since the introduction of the School Census in January 2002.
Of course, it’s well-known that free school meal eligibility is an imperfect proxy for economic disadvantage. Some families choose not to apply, while those whose circumstances are just above the eligibility threshold can hardly be considered advantaged.
There are now 230,000 fewer pupils eligible for free school meals than in 2013 – the impact of improving economic conditions, as well as changes to eligibility rules for some of the benefits which can qualify a child for free school meals, with criteria to receive lone parent’s income support having been tightened in 2012 [PDF].
But there are other interesting stories beneath the surface.
The impact of the universal infant free school meals policy
The first story is that the universal infant free school meals policy, introduced in September 2014, appears to have led to only a relatively small decrease in the number of children recorded as meeting the free school meals criteria.
All infant pupils now receive a free meal at lunchtime – meaning there’s less reason for parents to demonstrate that they qualify.
Despite this, the percentage of Reception to Year 2 children recorded as being eligible hasn’t dropped as much as some might have feared – but it has reduced by five percentage points.

Without any doubt, this will affect the amount of pupil premium funding that primary schools receive over the next six years – but the data suggests that schools have, by-and-large, worked hard to persuade parents to demonstrate their eligibility, and so fend off such falls.
What’s going on in London?
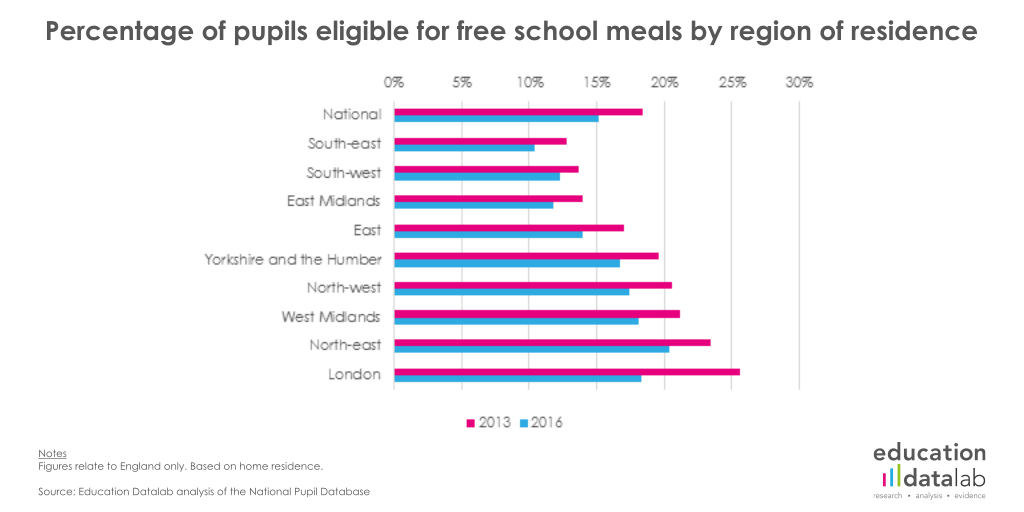
The other interesting conclusion relates to what has happened in London.
Since 2013, the share of London pupils eligible for free school meals has fallen by more than seven percentage points (and almost ten percentage points since 2005).
London is no longer the most deprived region when considered on this metric – the north-east now occupies that slot – and, should current trends continue, London will show as being less deprived than the west Midlands by 2017.
So what’s happened in London? Has the housing benefit cap forced disadvantaged families out of the capital, as has been suggested in some quarters? Or is this a result of London having weathered the economic problems of the last few years better than other parts of the country?
First, let’s look at those pupils who lived in London but who have now moved out of London.
The figure below shows the percentage of London pupils who moved elsewhere in England in the next 12 months, by free school meals eligibility.

The proportion of those not eligible for free school meals who moved out of the capital broadly declined up until 2010 – since when it has increased slightly.
Meanwhile, among those recorded as being eligible for free school meals, there was a noticeable increase in numbers leaving London between 2012 and 2013 – 2013 having been the year in which the housing benefit cap was introduced.
Even so, the increase is relatively small – just 0.4 of a percentage point.
So it seems like the housing benefit cap may have resulted in some pupils eligible for free school meals leaving London – but this this might not account for too much of the change.
What else could explain the change in London?
So what’s happened in London?
Could it be that London’s schools have been less successful than those in other regions in persuading the parents of infant pupils to provide evidence of free school meal eligibility?
It’s possible. But another explanation appears to lie in the growth in the number of pupils living in London.
Thinking about the period 2013-2016, three cohorts of children have ceased to be of compulsory school age, while another three groups of children have begun their schooling.
In London, the three cohorts that have started schooling were significantly bigger than those that left – more than 30 per cent larger in fact; double the national increase.
And how do the characteristics of those who have started school since 2013 compare to that of those who have left in the same period?
The difference in eligibility for free school meals between London children in the incoming cohorts and the outgoing cohorts is stark – close to eight percentage points – and much greater than the differences seen in any other region.

Taking this two facts together, this suggests that families with young children who might previously have moved out of London are instead staying – put bluntly, middle-class parents are voting with their feet, and remaining in London.
The kicker? While this demographic shift may well be related to the ongoing story of the success of London’s schools, it comes at a cost. As well as facing per-pupil funding reductions arising from the proposed national funding formula, London schools will see sizeable reductions in pupil premium funding per head in the years to come too.
Want to stay up-to-date with the latest research from Education Datalab? Sign up to our mailing list to get notifications about new blogposts, or to receive our half-termly newsletter.


Leave A Comment