Last week, we heard a lot from the government about their interest in children from ‘ordinary working families’. (For our initial take on the topic, see here and here.)
In its new consultation document, the Department for Education has provided information on the GCSE grades and progress of these children – defined as those not eligible for the Pupil Premium, but from a below-median-income household.
But what can the OECD’s PISA study tell us about these pupils?
The PISA definition
In PISA, Year 11 pupils are asked about the education and occupation of their mother and father, along with a series of questions about household possessions – a proxy for family wealth. A continuous index is then formed based upon this information.
Dividing this into five equal groups, or quintiles, we can define the middle group as ‘ordinary working families’. To put this into context, a typical profession in this group would be work as an estate agent, an office supervisor or a medical/legal secretary, with a level of education below degree level. (Note that our definition of an ordinary working family diverges somewhat from that used by the DfE – our measure encapsulates a fifth of all pupils, while roughly a third of pupils fall under the DfE definition.)
Average PISA scores for ordinary working families
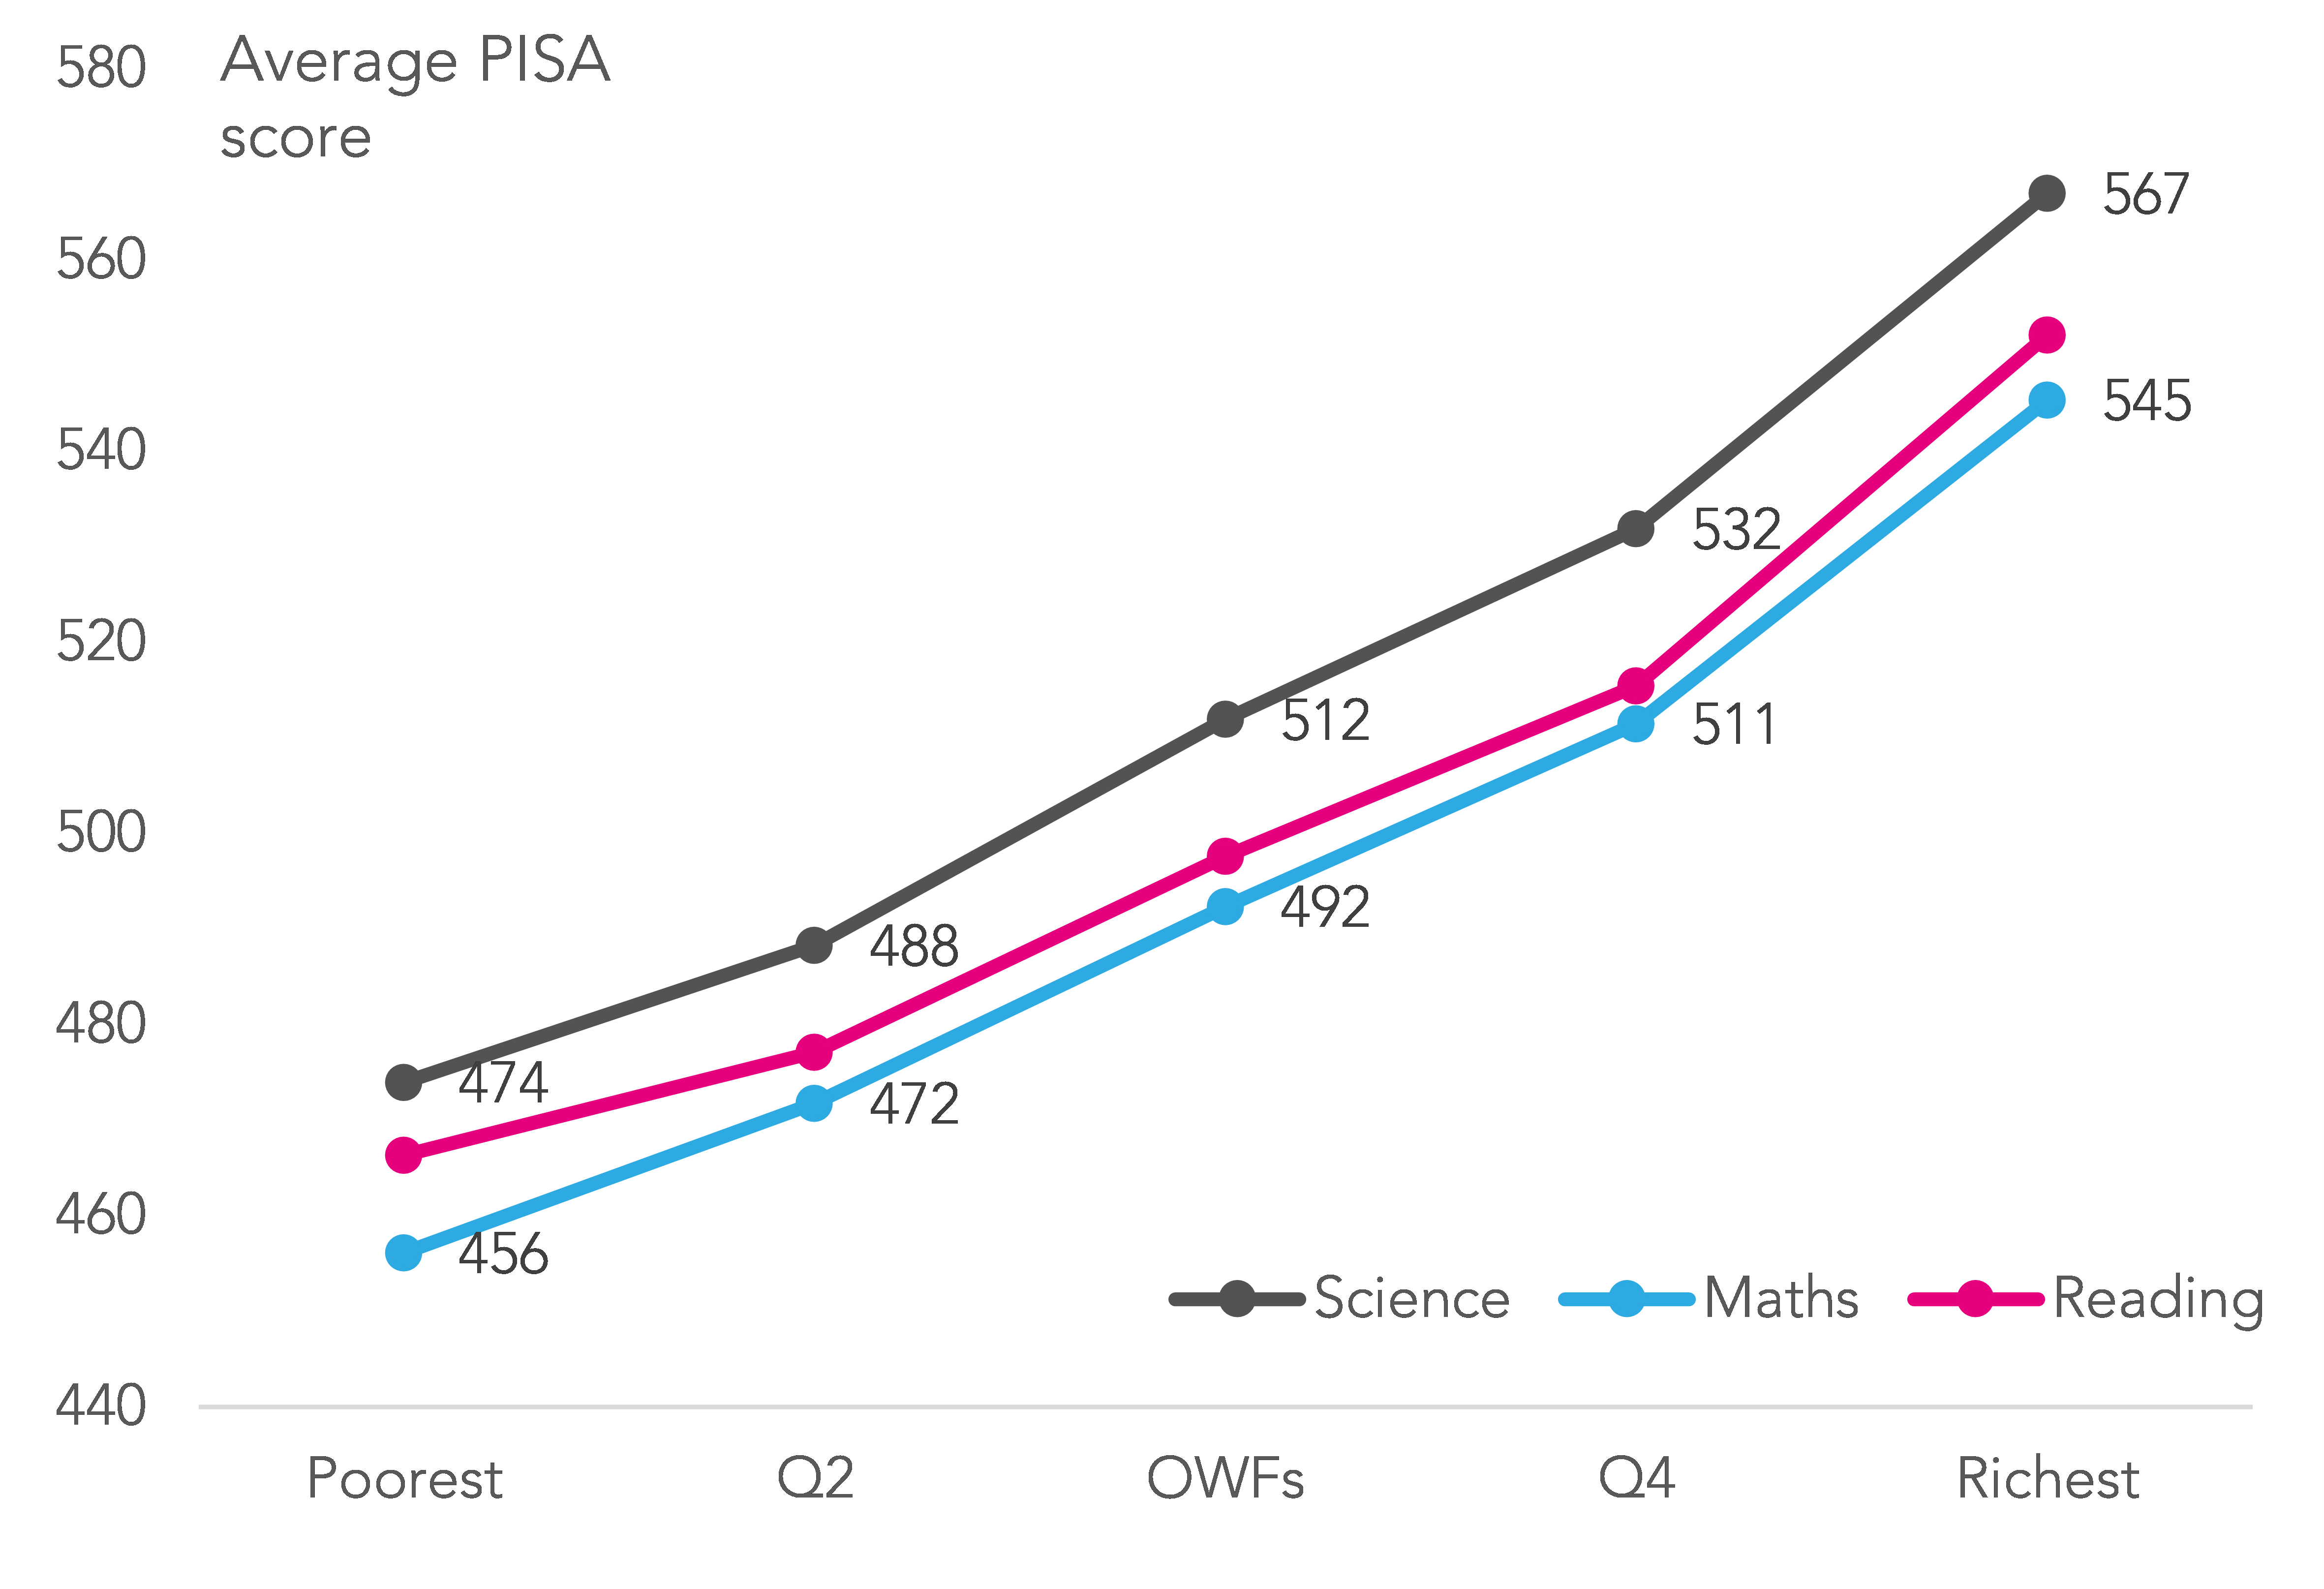
The graph below provides the average PISA 2015 scores of ordinary working families (OWFs) in reading, maths and science, along with pupils from other backgrounds.
Perhaps the most striking feature of this graph is just how far the most advantaged 20% of the population are ahead of the rest of the 80% of the population in England.
For instance, in all three core PISA subjects, children from the most advantaged 20% of families are more than a year of schooling ahead (on average) than any of the four other socio-economic groups. Comparing specifically to the OWFs group, the most advantaged are around two years of schooling ahead.
PISA 2015 results in reading, maths and science by socio-economic status
Looking beyond academic achievement outcomes
PISA tells us a lot more than simply the OWF group’s achievement in school.
Information is also collected in a background questionnaire about things like pupils’ self-efficacy, motivation, discipline in their school classrooms, and their sense of belonging in school.
The graph below illustrates how Year 11s from ordinary working families compare to other groups.
PISA 2015 non-cognitive outcomes by socio-economic status
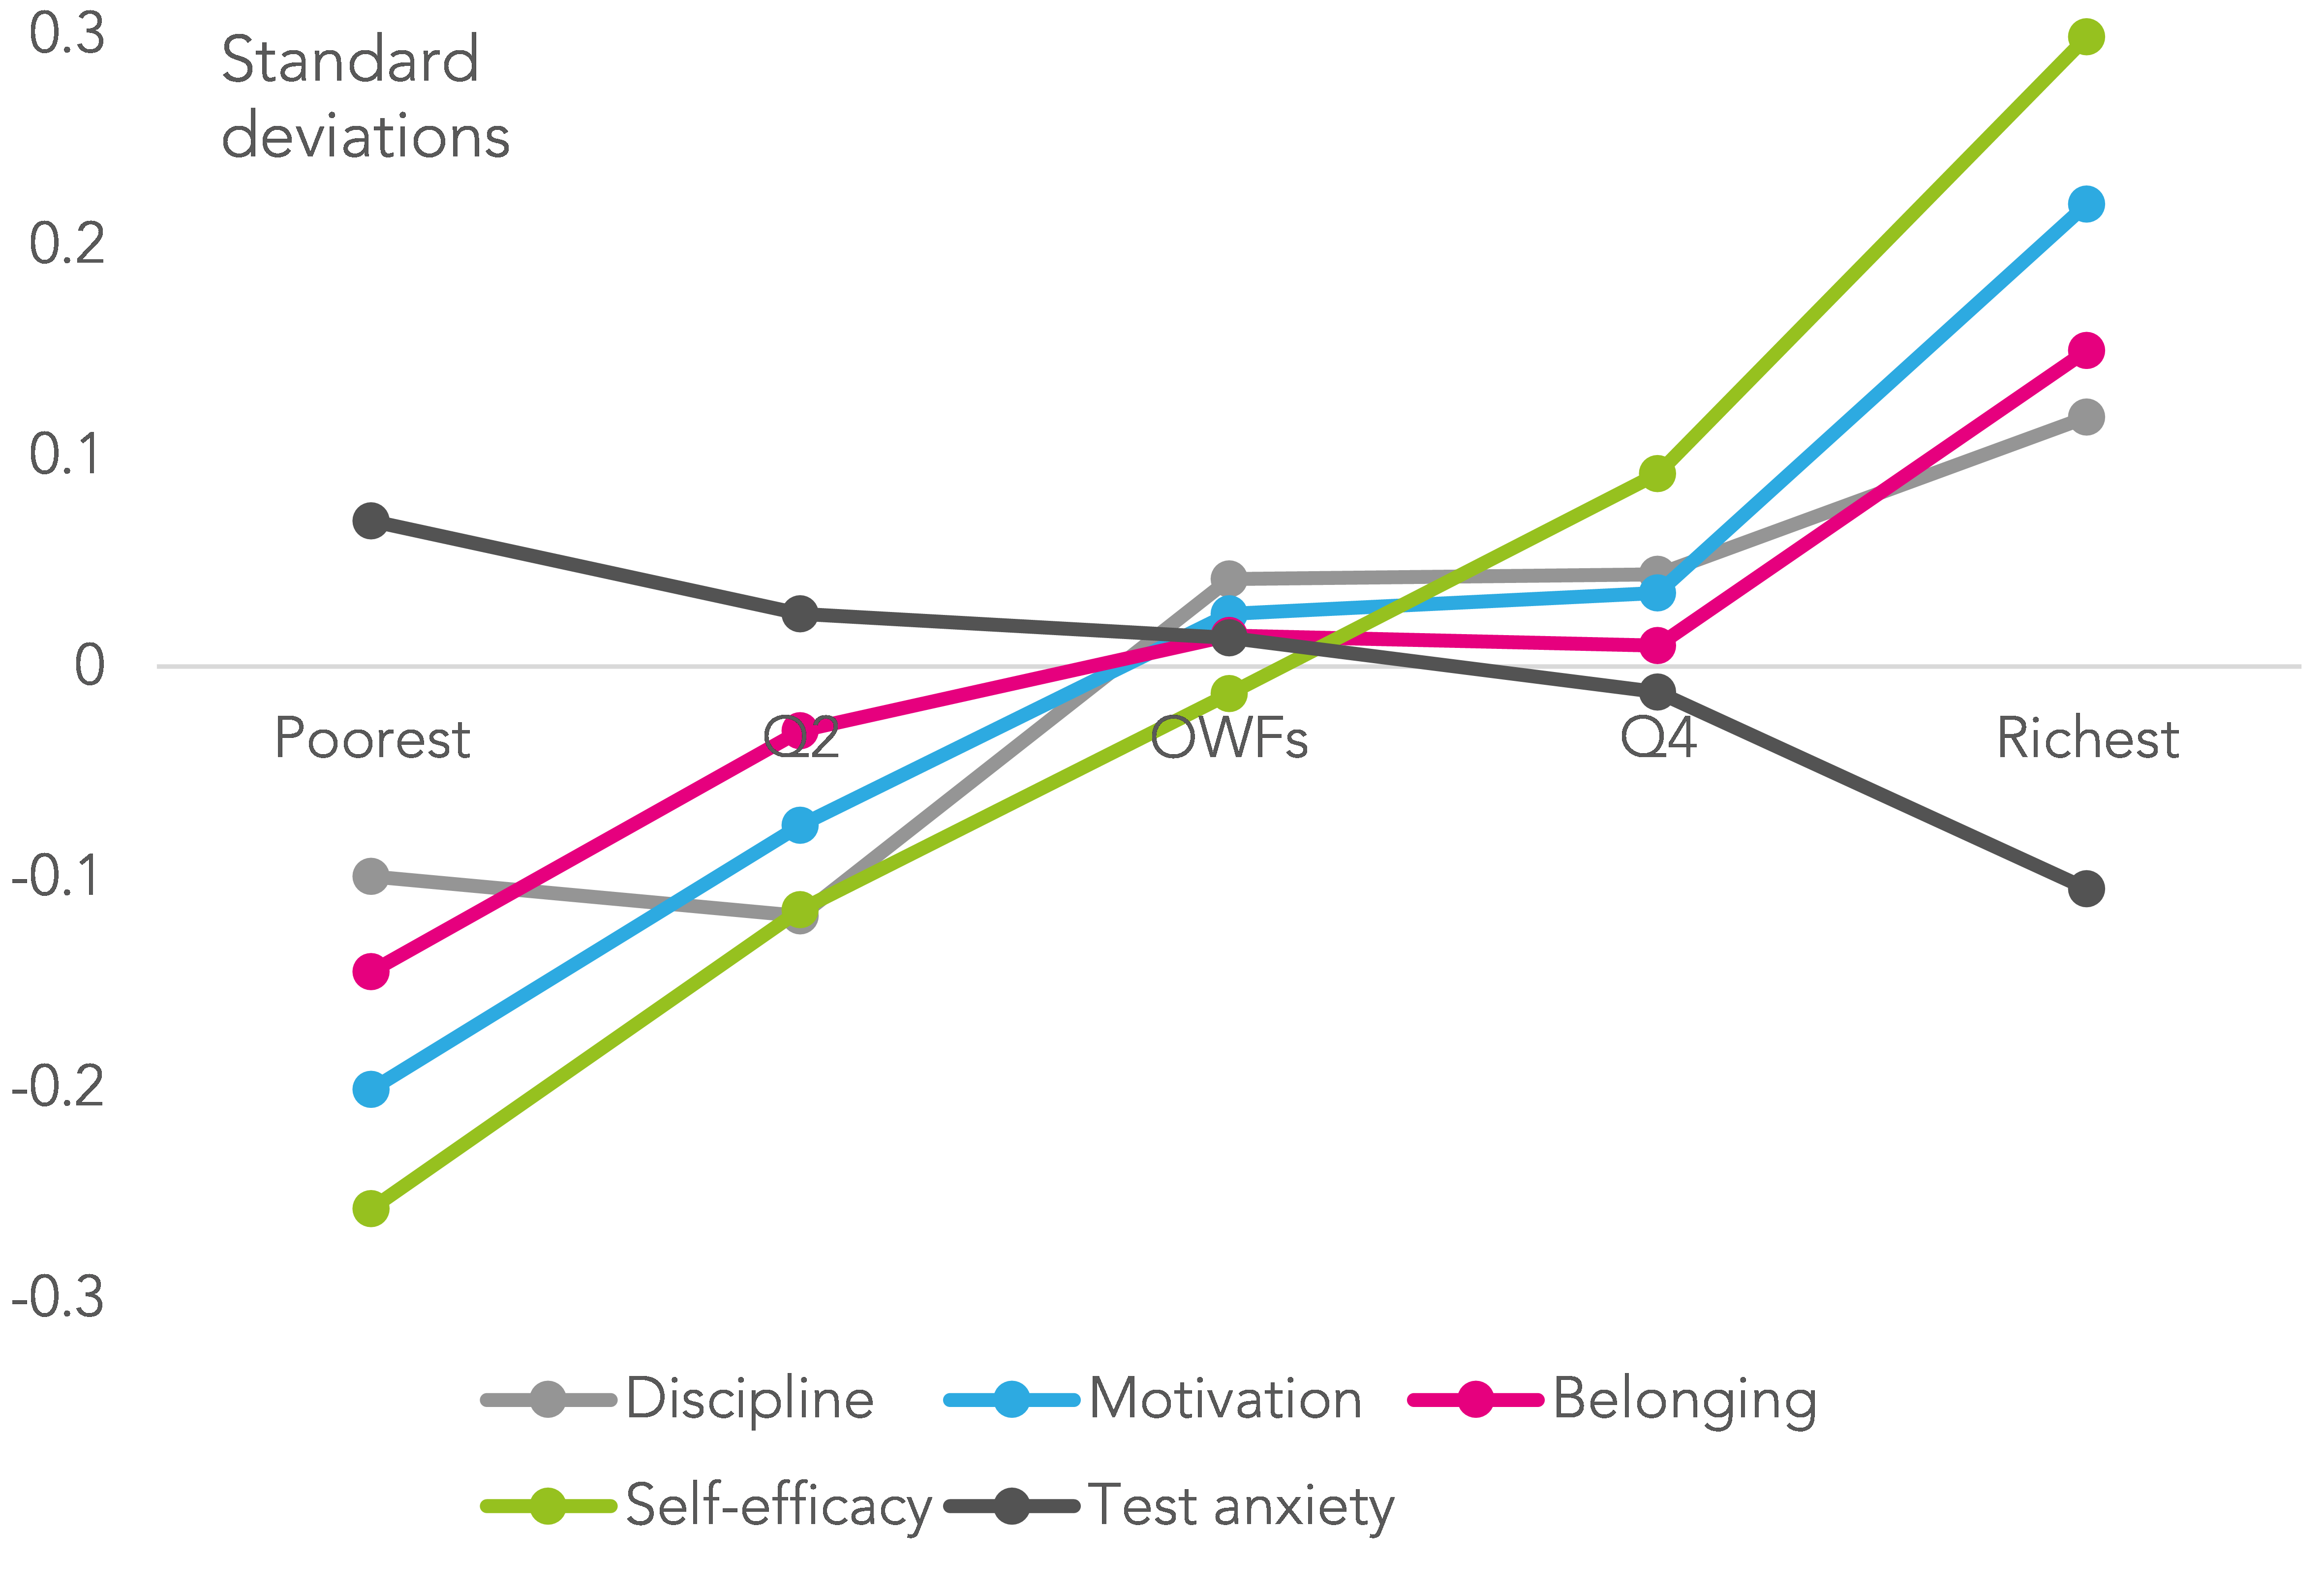
One of the striking features of this graph is how the middle 60% of the population in terms of socio-economic status tend to be quite similar. That is, they report similar levels of test anxiety, sense of belonging and motivation in school.
On the other hand, the most advantaged and most disadvantaged pupils are always substantially different from other groups. In particular, we see big differences (up to half a standard deviation) between children from rich and poor families in terms of self-efficacy, motivation in school and the level of discipline in the school classroom.
The take-away
What does this imply for the government’s recently announced consultation?
Well, a lot of the consultation document focused on how best to link children’s attainment in Key Stage 2 and GCSE exams to a measure of household income, in order for policymakers to get a better understanding of this under-researched group.
This is, however, quite a narrow focus – and we have potentially a host of other resources to help us better understand the outcomes of young people from ordinary working backgrounds. Indeed, given the government’s seeming obsession with PISA, and the fact that almost a million pounds is spent collecting this data per three year cycle, it seems a glaring omission that the DfE did not even bother to mention this resource.
Rather than using PISA as a stick with which to beat schools every three years, it would be nice to see the DfE actually use the data that they collect to inform their policy documents, or at least recognise that other sources of information exist besides the National Pupil Database.
Want to stay up-to-date with the latest research from Education Datalab? Sign up to our mailing list to get notifications about new blogposts, or to receive our half-termly newsletter.


Leave A Comment